Report Descriptions
Download ManualThe information included here covers the standard reports available via the report wizard and reporting interface. Information does not reflect reports customized for your system. For example, some reports may have additional fields or hidden fields. Report names and headers used in the example reports may be different on your system.
Reports are available in multiple download options. Many reports have summarized graphical data and are in a responsive, mobile-friendly format that is WC3 compliant. You must use a modern browser and Internet Explorer version 9 and higher to view report graphs.
Reports have a unique identifier so for easy identification. This is especially important if your organization has renamed any reports.
R101 Participant Record Overview
Run R101 to view a single user’s group and product enrolments, access codes, earned certifications, affidavit activity, and supplemental training records. The report below is bisected to display it in its entirety.
The image below shows an example of R101.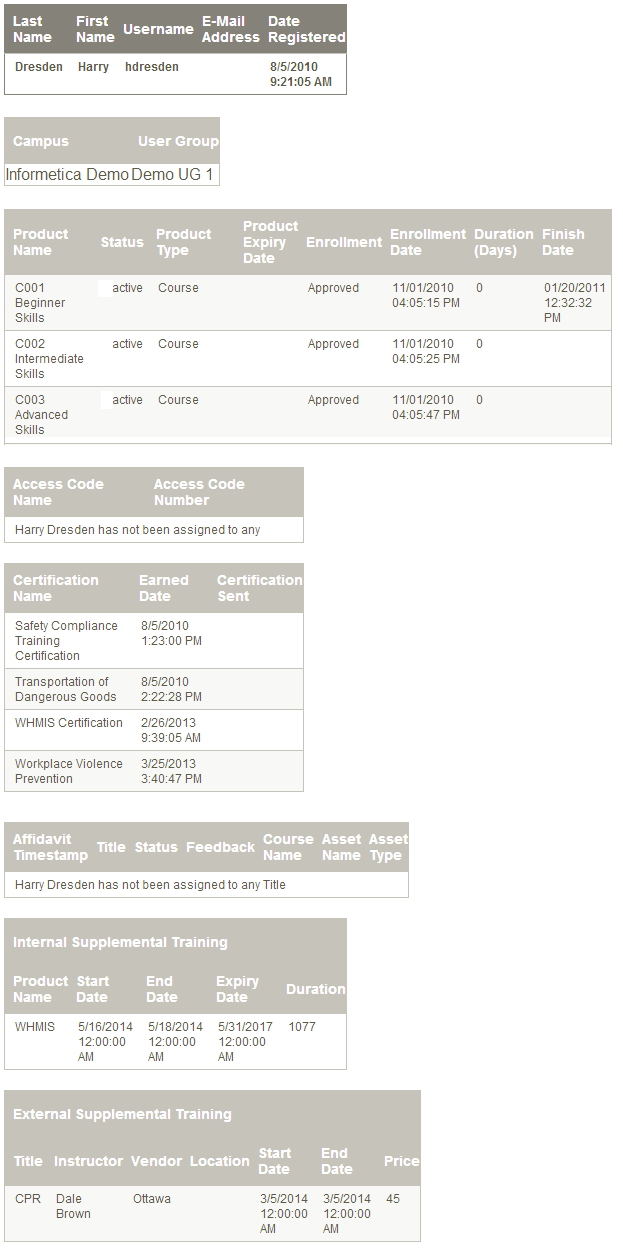
R102 Participant Questionnaire Scores
Run R102 to view the bucket results for each questionnaire registered to a defined user.
The image below shows an example of R102.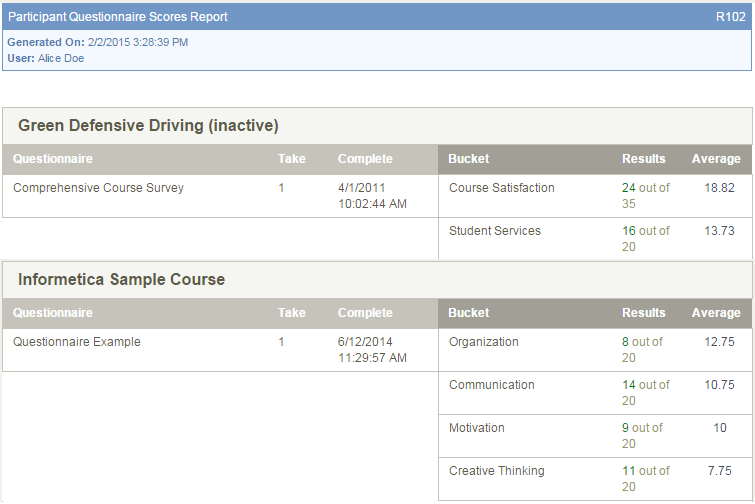
R103 Grades by Participant DEPRECATED
![]() R103 has been replaced by R109 and is no longer supported. If your system has access to this report, a Site Manager can create a ticket to request R109.
R103 has been replaced by R109 and is no longer supported. If your system has access to this report, a Site Manager can create a ticket to request R109.
Run R103 to view one individual’s grades for all of the products they are enroled to. In step 3, you can group all published versions of the Prova tests into one result. The report generates a separate entry box for each product.
The image below shows an example of R103.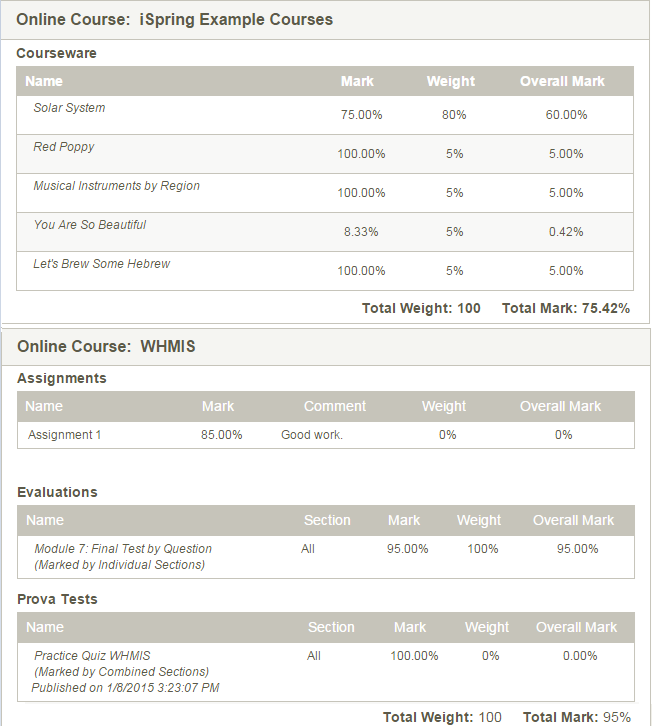
| Field | Description |
|---|---|
| Mark | The grade earned for that asset. |
| Weight | Percentage that a test is worth towards the overall product’s grade, if applicable. |
| Section | The grade for a test that is configured for section pass values. |
| Comment | Available for manually graded items. |
| Overall Mark | The overall grade received for the entire product, if applicable. |
R104 Affidavit Compliance Status by Individual
![]() You may also be interested in R205, a similar report that can be run on groups.
You may also be interested in R205, a similar report that can be run on groups.
Run R104 to view all affidavit interactions for a single individual.
The image below shows an example of R104.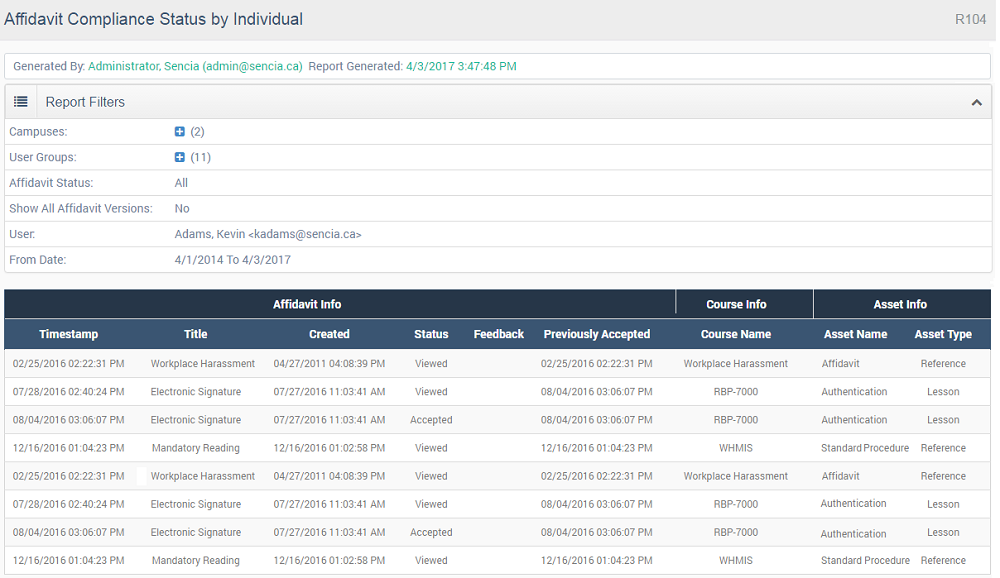
R105 Participant Test Responses
Run R105 to view a user’s information and responses to a single test, questionnaire, or appraisal, including the test questions, associated feedback, correct answers, and the user's answers. R105 does not capture SCORM test results. Below are three examples of R105 run on different asset types.
The image below shows an example of R105 showing a test configured to grade by individual sections.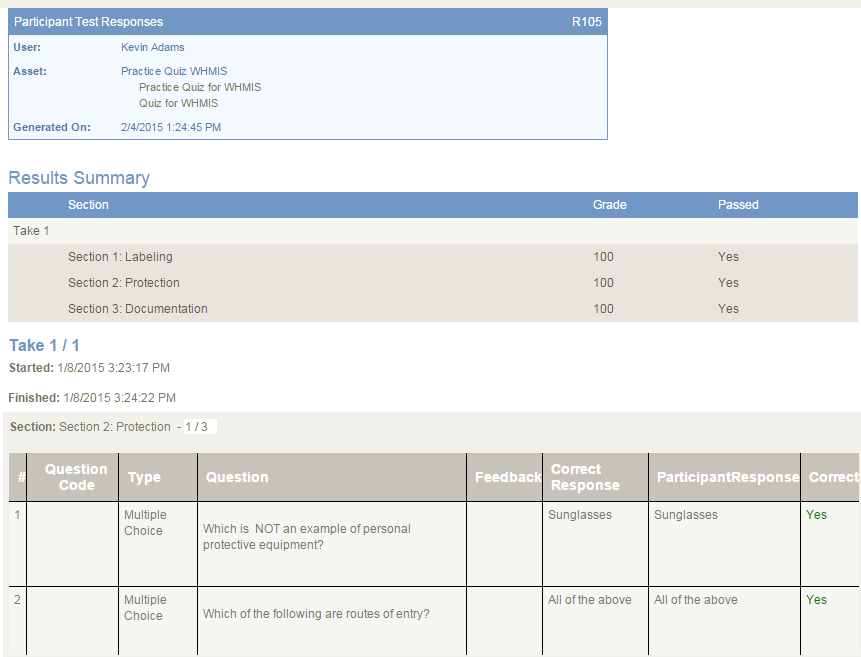
The image below shows an example of R105 showing a questionnaire.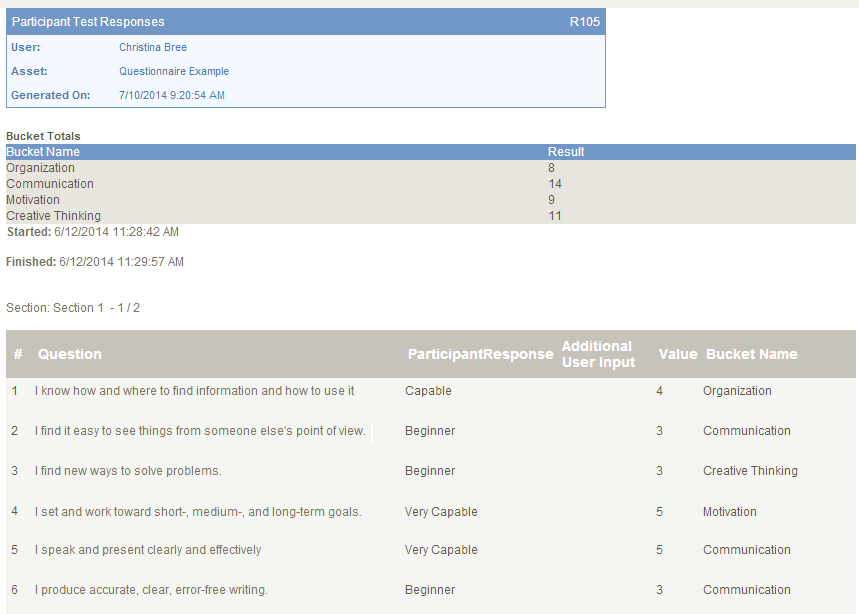
The image below shows an example of R105 showing an appraisal.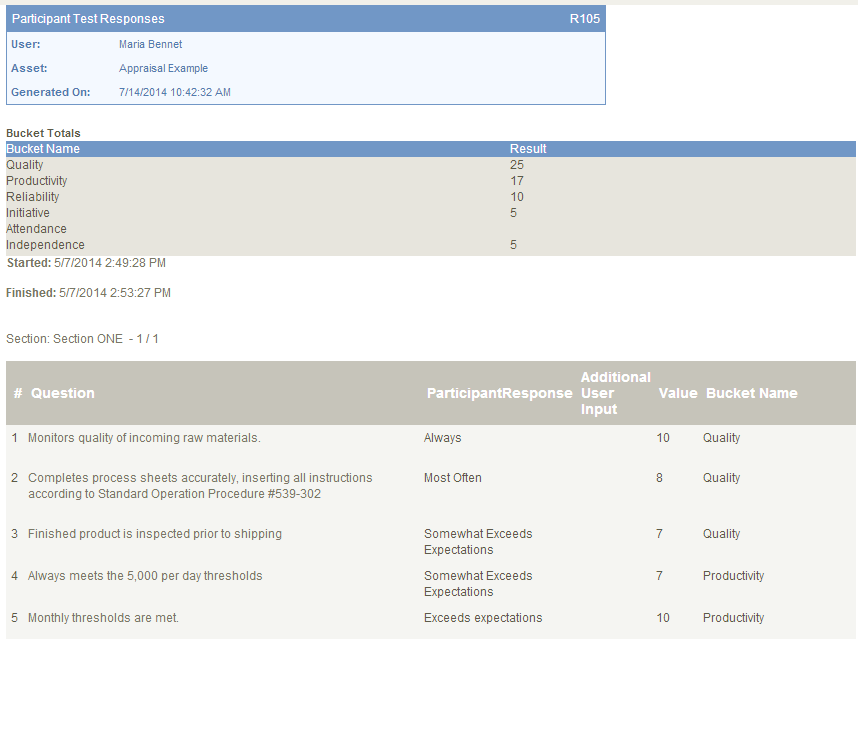
R106 User Activity Breakdown
For a given date range, run R106 to view the products a user has accessed and how much time the user has spent in them. The report also offers details on the duration of time the individual spent on the assets within a selected product. This image shows the Summary view. The graph shows the top products visited and the data below shows information for all products visited.
The image below shows an example of R106 run as a summary report with multiple products.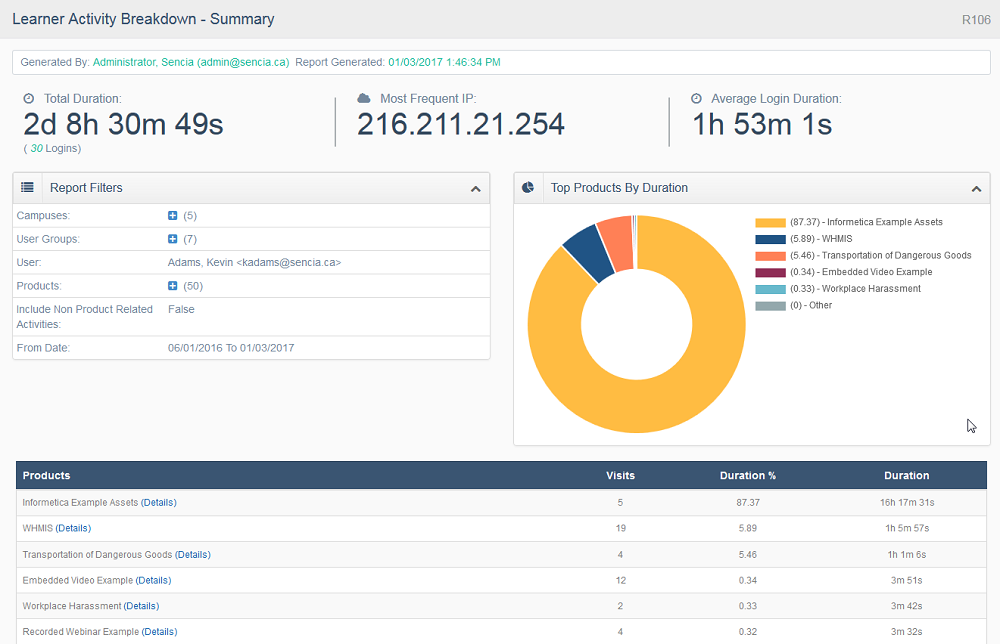
The image below shows an example of R106 showing the detailed view, accessed by selecting Details for a product from the Summary view.
For the selected product, the graph shows the top asset visited and the details below contain information for all assets visited.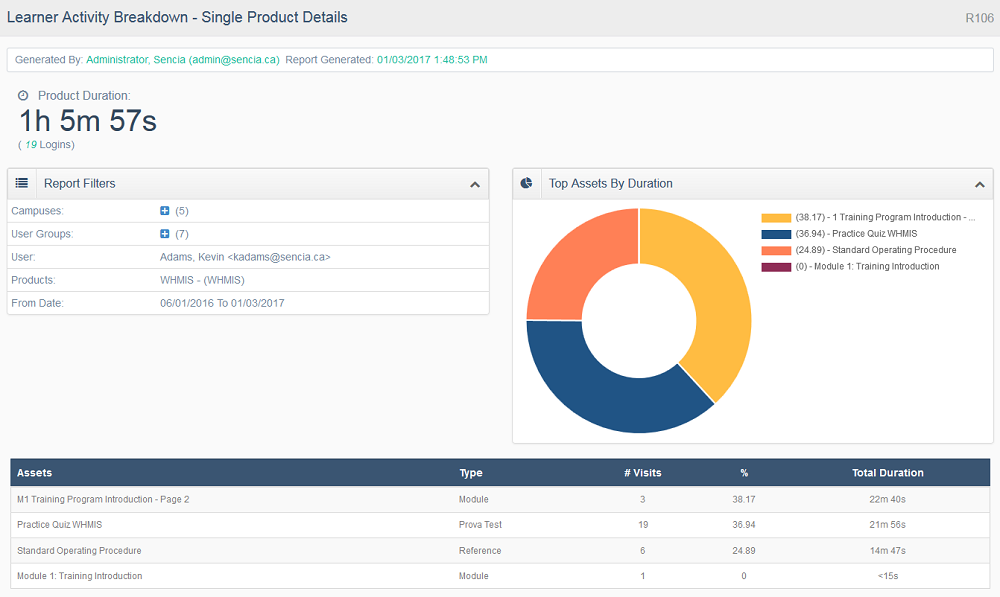
The image below shows an example of R106 run as a detailed report with one one product selected.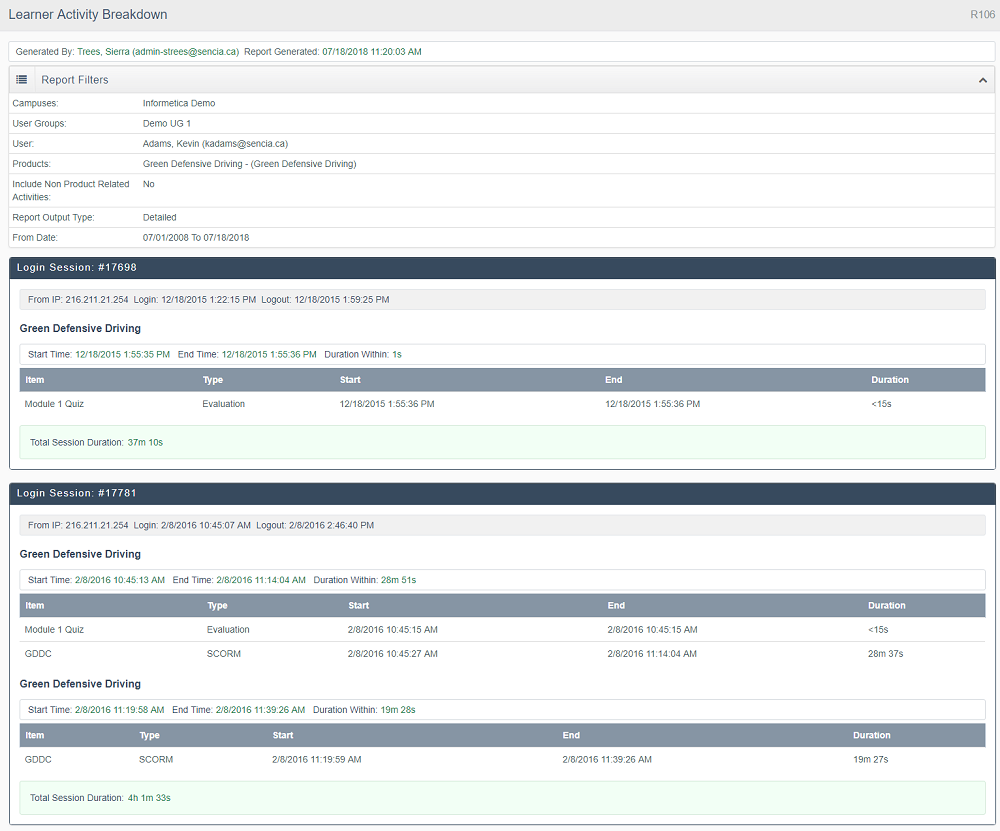
R107 Participant Completion Status DEPRECATED
![]() R107 has been replaced by R109 and is no longer supported. If your system has access to this report, a Site Manager can create a ticket to request R109.
R107 has been replaced by R109 and is no longer supported. If your system has access to this report, a Site Manager can create a ticket to request R109.
Run R107 to view an individual’s pass, fail and completion status for all assets within a product they are assigned to. This report applies to evaluation, assessment, and SCORM assets. In step 3, you can group the published versions of all Prova tests into one result.
The image below shows an example of R107.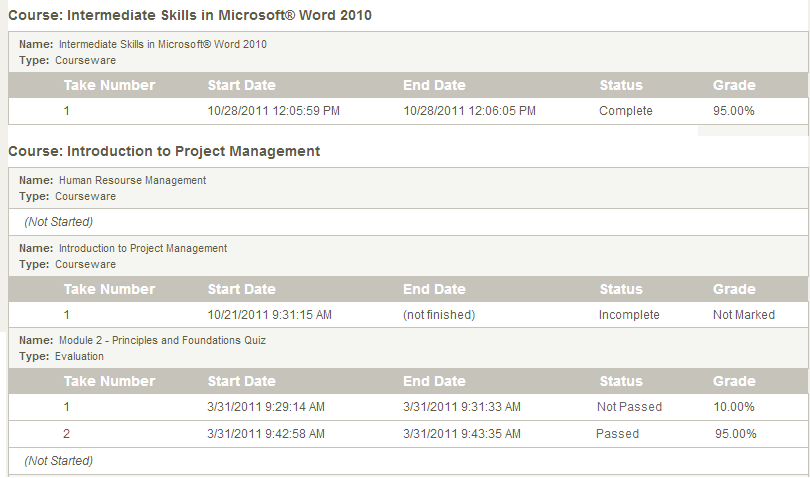
R108 Participant Taxonomy Performance
![]() This report does not identify the questions themselves. Questions that are not associated with a taxonomy are not reported.
This report does not identify the questions themselves. Questions that are not associated with a taxonomy are not reported.
Run R108 to identify the performance gaps and successes of an individual for specific taxonomy terms used within selected tests. Taxonomy terms are automatically reported based on the tests that you select. There is a separate entry for each test and attempt.
The image below shows an example of R108.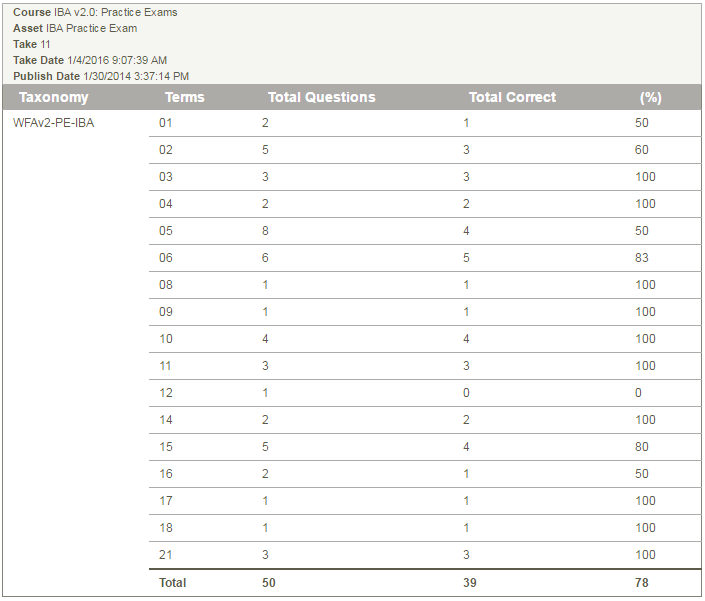
| Field | Description |
|---|---|
| Taxonomy | Main level terms (parent) associated to test questions. |
| Terms | Nested level terms (child) associated to test questions. |
| Total Questions | The total number of questions belonging to the taxonomy term. |
| Questions Correct | The total number of questions the participant got correct within the taxonomy term. |
| % | The percentage of correct questions within the taxonomy term. |
R109 Individual Progress & Grades
![]() R109 replaces older similar reports R103 and R107. You may also be interested in R202, a similar report for user groups.
R109 replaces older similar reports R103 and R107. You may also be interested in R202, a similar report for user groups.
Run R109 to view one individual’s grades, progress, and completion status for selected assets within the products selected including the level of completion and grade for each test attempt. This report applies to all assets with gradable or completion capability: appraisals, assignments, evaluations, modules, SCORM, questionnaires, tests (both classic and prova), and custom assets as required by individuals clients).
The report generates a separate table for each product and enrolment showing all attempts (e.g. if the individual attempted a test 5 times in one enrolment, there will be 5 entries for that test. The report output will display all of an individual's enroled products and assets if filters are not selected in step 3.
The image below shows an example of R109 with the option selected to show weights.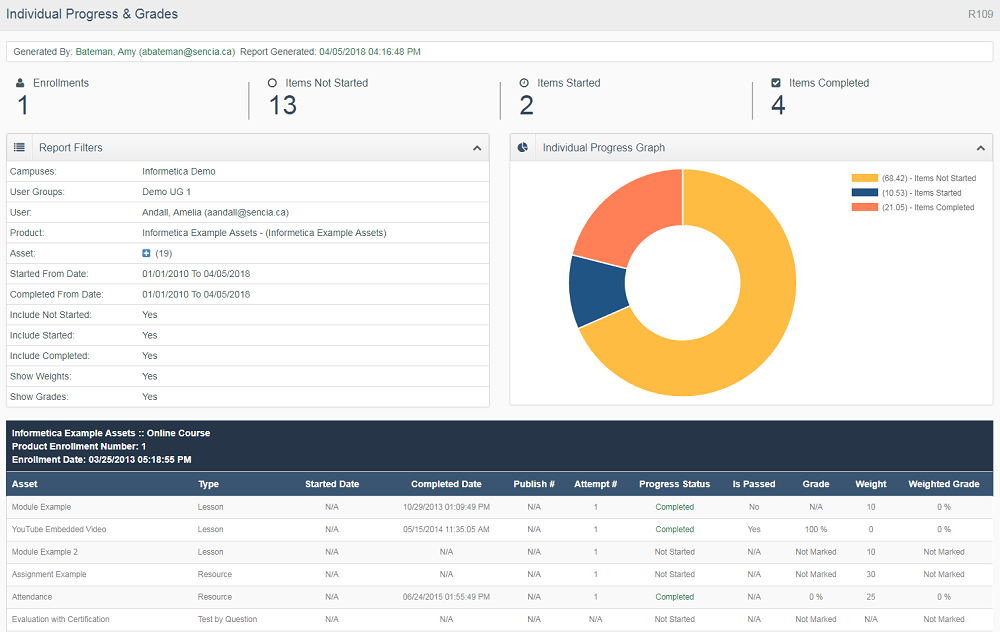
![]() If a selected asset does not have any gradable or completion elements, then the report will show:
If a selected asset does not have any gradable or completion elements, then the report will show:
- Progress Status as Not Started
- Passed as N/A
- Grade as Not Marked
R110 Individual Certification Progress
![]() You may also be interested in R209, a similar report for groups or R502, a report that shows the requirements for selected certifications.
You may also be interested in R209, a similar report for groups or R502, a report that shows the requirements for selected certifications.
Run R110 to view one user's progress toward any of the certifications they are eligible to earn as well as a summary of the requirements. The report generates a separate table for each certification showing the requirements for each (e.g. required assets, asset types, required grade).
![]() If a selected asset does not have any gradable or completion elements, then the report will show the Required Grade as N/A.
If a selected asset does not have any gradable or completion elements, then the report will show the Required Grade as N/A.
The image below shows an example of R110 where a certification is completed.
The image below shows an example of R110 where a certification has expired. It includes the oroginal date the certification was earned and the date that is expired.
The image below shows an example of R110 where certification requirements have been met, but the user does not have the certification applied to their profile This typically happens if a certification was created after the requirements were met. The Check Eligible Users tool can be used to apply the certification to the user. 
The image below shows an example of R110 where a certification has partial completion. 
R111 Individual Training Path (Formerly Certification Set) Progress
![]() You may also be interested in R223, a similar report for groups or R226, that reports individual user completions on each associated certification in the certification set.
You may also be interested in R223, a similar report for groups or R226, that reports individual user completions on each associated certification in the certification set.
Run R111 to view a user's progress toward one or more of the training paths (formerly certification sets) they are eligible for, as well as a summary of the required certifications and their completion status.
The report generates a separate table for each training path showing the certifications required for each set. The earned date of the training path is the date the individual earned the last certification requirement in the set. The Expiry Date is the earliest date that any one of the required training paths in the set expires.
The image below shows an example of R111 that shows examples of all stages of progress.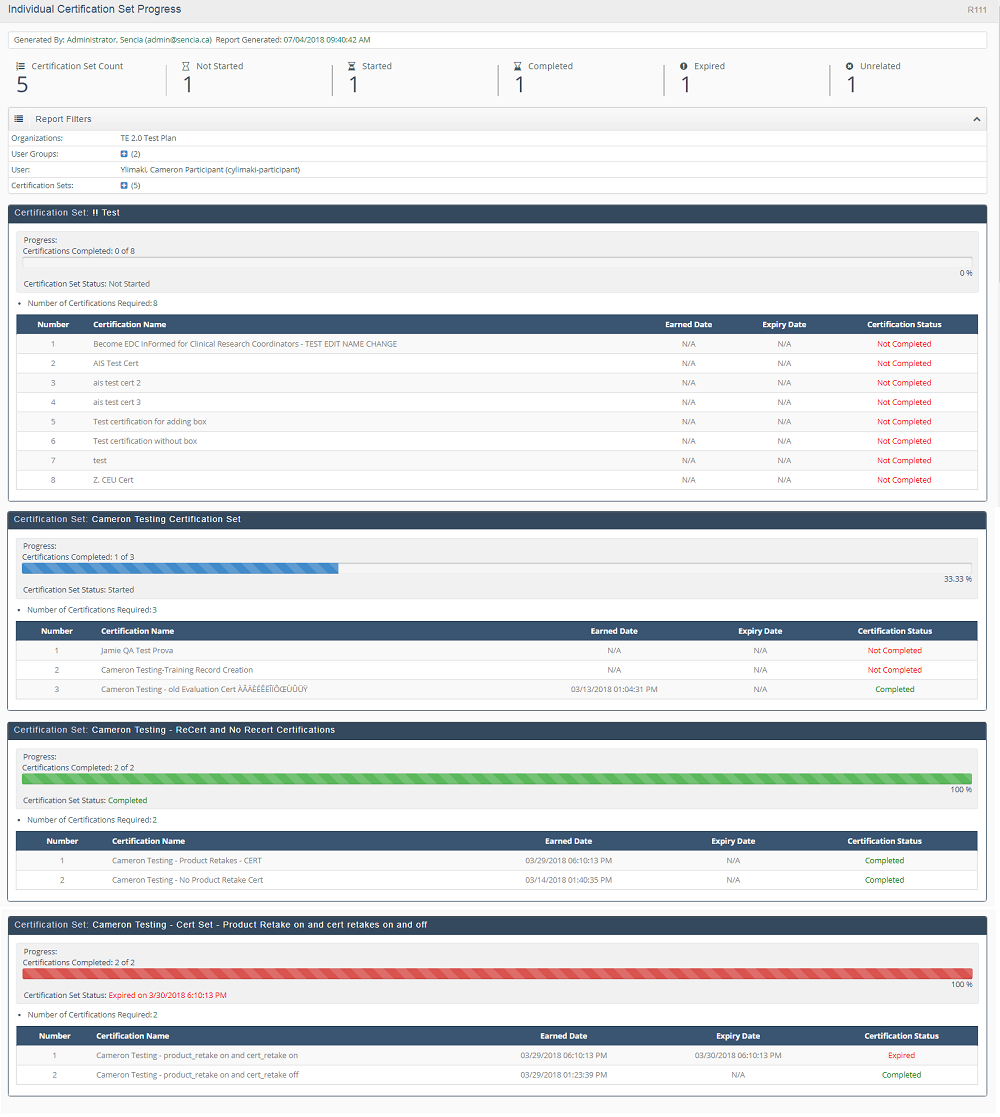
R201 Product Expirations
![]() R201 has been replaced by R213 and is no longer supported. If your system has access to this report, a Site Manager can create a ticket to request R213.
R201 has been replaced by R213 and is no longer supported. If your system has access to this report, a Site Manager can create a ticket to request R213.
Run R201 to view a list of individuals enroled to products that will be expiring (based on defined product expiry date) and the date they enroled to the products. The report covers a date range starting with the current date through a future date of your choice.
The image below shows an example of R201.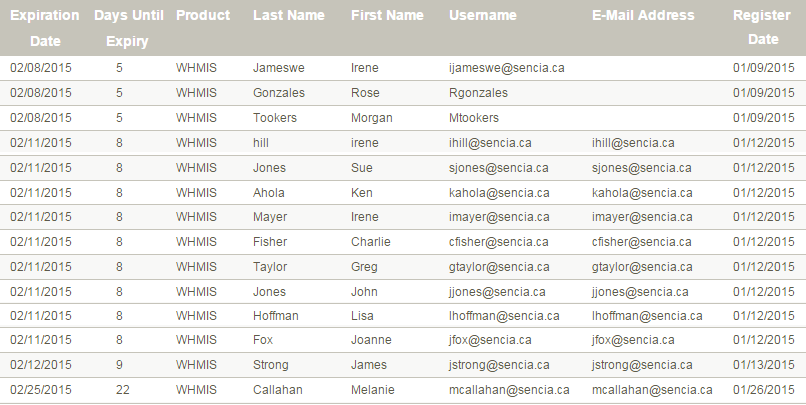
R202 Participant and Grade Details by Classification
![]() You may also be interested in R105 a similar report for individuals that shows grades received per attempt.
You may also be interested in R105 a similar report for individuals that shows grades received per attempt.
Run R202 to view a progress summary for the selected SCORM and tests (classic and Prova), including the level of completion and grade for each attempt. There are a number of filters to run this report against, including user type, discipline, and last login date range. You may elect to run the report on a single individual or view only the most recent attempt. In step 3, you can group all published versions of Prova tests into one result.
The image below shows an example of R202.
| Field | Description |
|---|---|
| Filter by Status | Not started, Started, Completed, and All (individuals who have any one of the other statuses). Individuals may appear multiple times with a different status. For example, if the learner named Sara completes a learning item and then starts the item a second time, she will appear under both started and completed. |
| Grade by Individual Section Configuration |
Classic evaluations (not Prova) show the best effort a participant received on an attempt until they earn a better mark. It does not show the specific grade obtained for that attempt. For example, Sara attempted a test 3 times and scored 50, 35, and 100. The report shows two attempts with the highest score of 50 until Sara scored 100 on her third attempt. |
R203 Group Questionnaire and Appraisal Scores
Run R203 to view the scores for each questionnaire or appraisal bucket including the section, the number of takes, and the average results of the selected user groups within each question bucket. Select detailed response metrics to see scores and frequency of specific distractors within each question.
The image below shows an example of R203.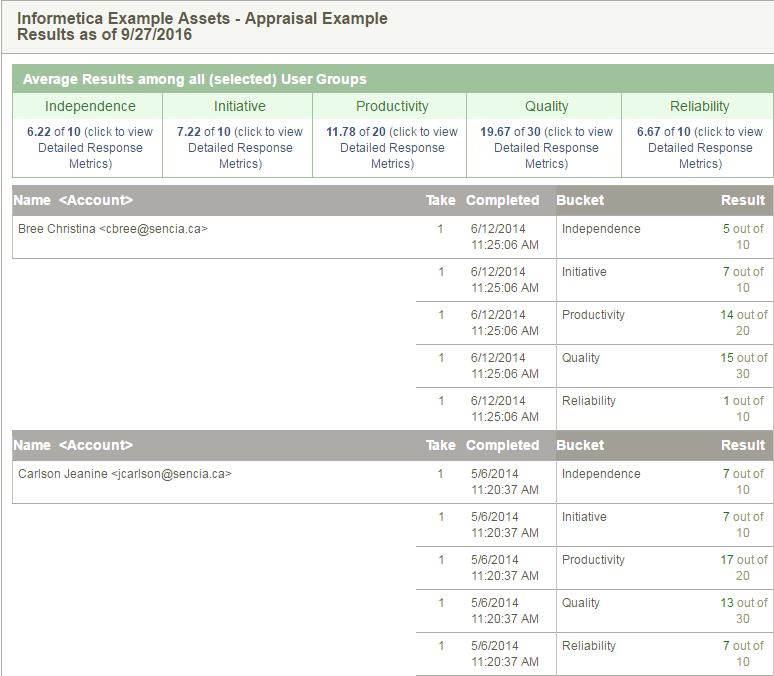
The image below shows an example of detailed metrics for a selected bucket.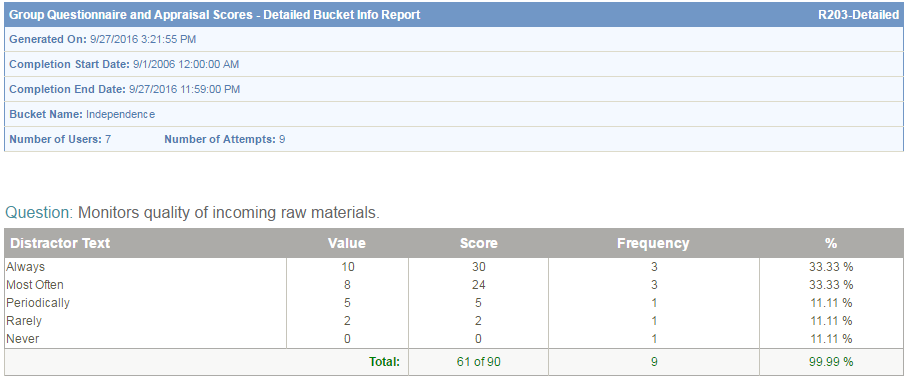
R204 Grades by Product
Run R204 to view the grades for selected evaluations (classic and Prova), assignments, modules, and SCORM assets for selected products. The report returns the highest grade obtained by individuals and shows the number of attempts and results by section. Individuals who have not obtained a grade will not be on the report. In step 3, you can group all published versions of Prova tests into one result.
The image below shows an example of R204 reporting on a Prova test that is configured to give a grade for each section in the test.
The image below shows an example of R204 reporting on a SCORM course.
![]() For evaluations graded by section, the section grade is the first passing grade recorded for that section for any attempt. Evaluations graded by section do not allow indivuduals to reattempt a section once passed, so subsequent attempts will inherit the section grade from the first attempt that is successfully passed.
For evaluations graded by section, the section grade is the first passing grade recorded for that section for any attempt. Evaluations graded by section do not allow indivuduals to reattempt a section once passed, so subsequent attempts will inherit the section grade from the first attempt that is successfully passed.
R205 Affidavit Compliance Status by Product
![]() You may also be interested in R104, a similar report for individuals.
You may also be interested in R104, a similar report for individuals.
Run R205 to view affidavit activity for all individuals within the selected user group for selected assets. Information includes the outcome of the interaction (i.e. an indication if the individual accepted, rejected or viewed the affidavit), a timestamp for each interaction, and if they accepted an earlier version of the affidavit. By default, only the most recent version of an affidavit is shown. You can opt to report on all versions in Step 3 of the report wizard. An affidavit must be associated with a specific asset rather than the product as a whole.
The image below shows an example of R205. 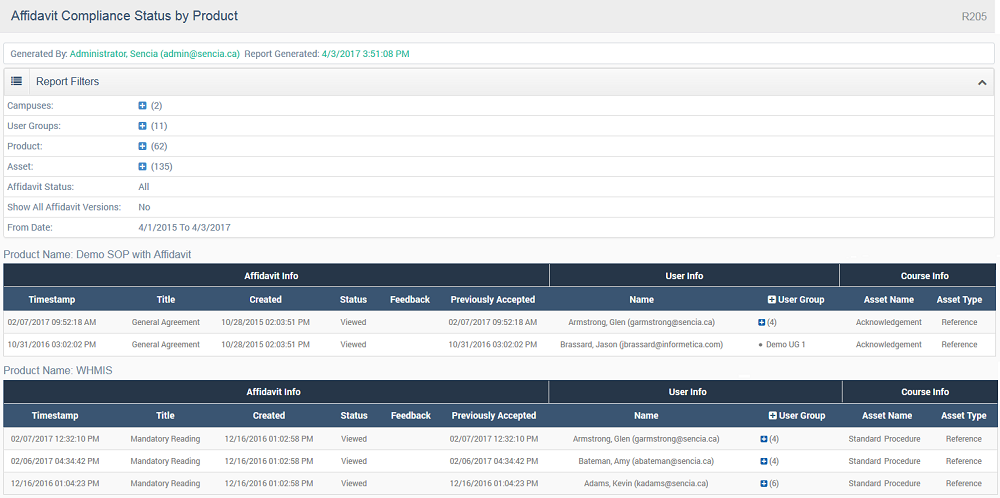
R208 Level of Completion by Asset
Run R208 to view group completion status for selected tests, modules, questionnaires, appraisals, SCORM assets, and some integrated client proprietary testing systems. Filter by completion status and date range. In step 3, you can group all published versions of Informetica-created tests (Prova) into one result, based on site configuration.
![]() Tests, modules, questionnaires, and appraisals must have completion rules set to ensure they are reported as complete. Completion based on affidavit acceptance is also reported.
Tests, modules, questionnaires, and appraisals must have completion rules set to ensure they are reported as complete. Completion based on affidavit acceptance is also reported.
The image below shows an example of R208 that reports on two tests with ALL completion statuses selected.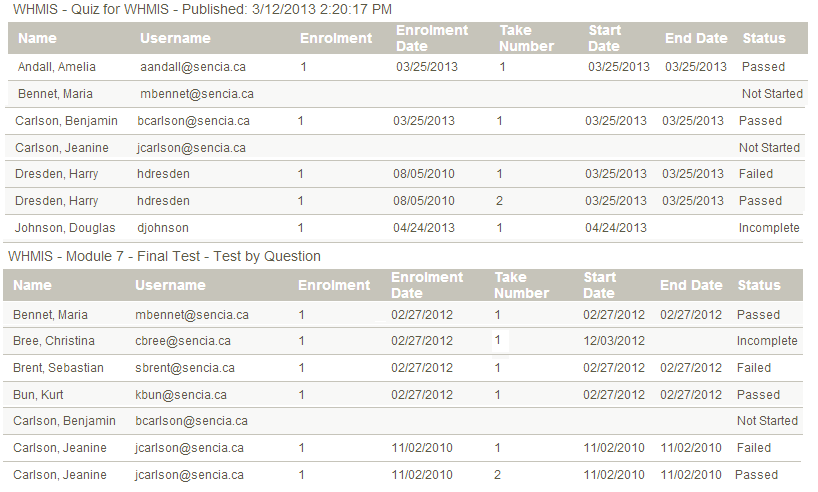
R209 Group Certification Progress
![]() You may also be interested in R110, a similar report for individuals.
You may also be interested in R110, a similar report for individuals.
![]() Certifications won't appear on this report if a user is moved to a different group not associated with this certification.
Certifications won't appear on this report if a user is moved to a different group not associated with this certification.
Run R209 to view the progress toward a specific certification for individuals in selected user groups. You can filter the report to see specific user types. The HTML version of this report lets you drill down to individual details that can also be exported, essentially running R110 Individual Certification Progress.
The image below is an example of R209 filtered to show two tests with ALL completion statuses selected.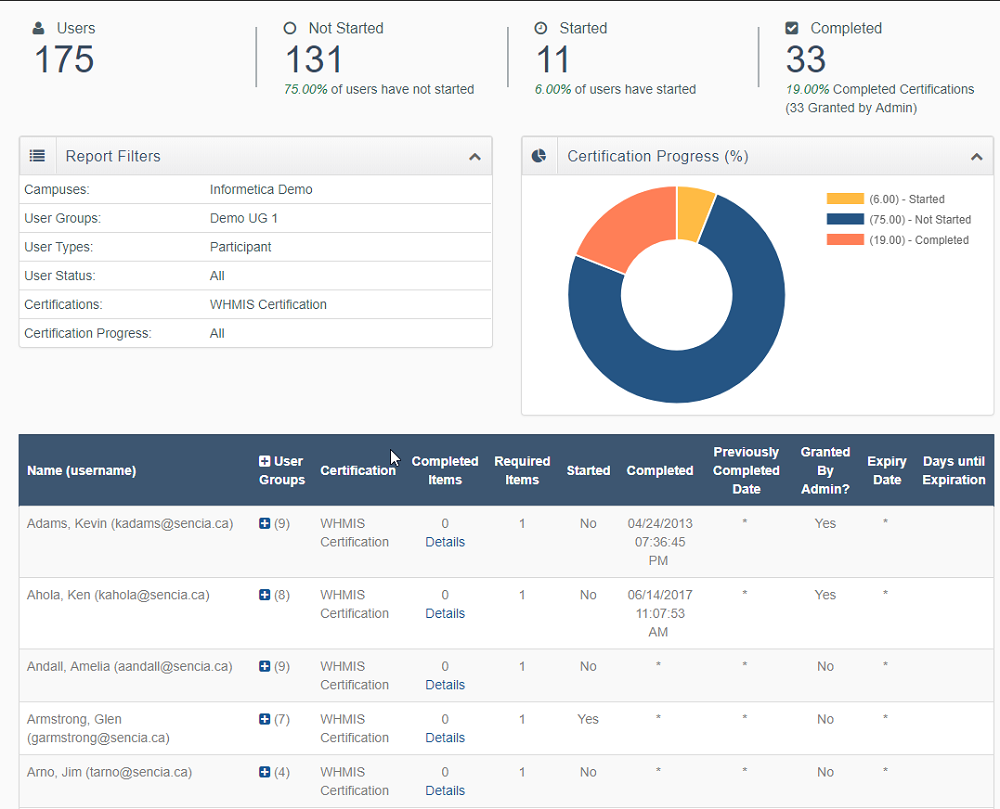
The image below shows where you can select the detailed version for an individual.
R213 Product Enrollment and Completion
Run R213 to generate a list of individuals enrolled to a single product, the date they enrolled, date of product completion, enrolment status, and the number of days they have left to access the product (duration) based on the expiry date, if applicable. Note that this report shows the names of all individuals enrolled to the product, including archived users.
The image below is an example of R213.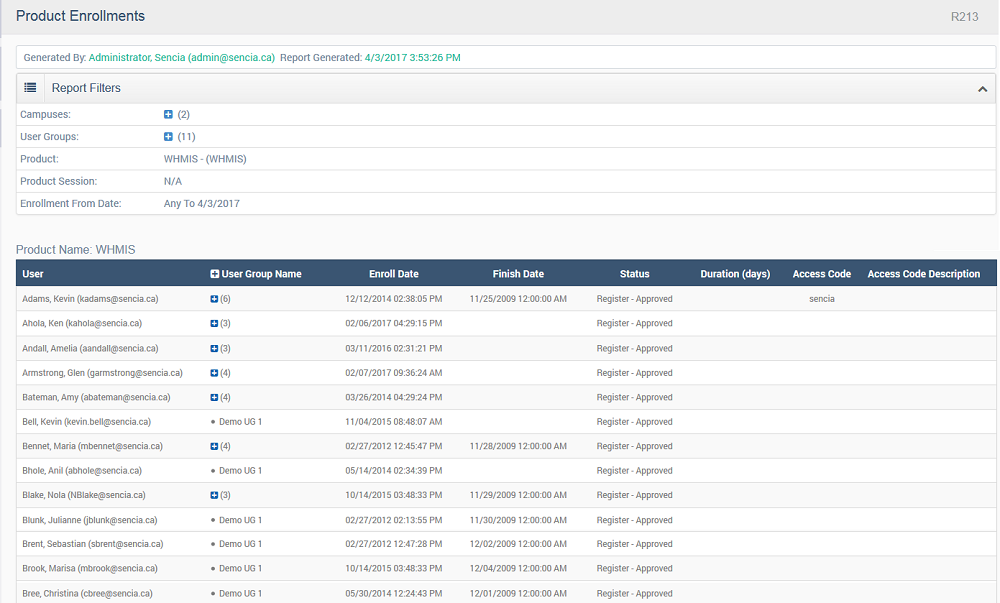
R219 Questionnaire Response Comparison
Run R219 to view user responses for each question within a defined questionnaire. View question responses, response values, and any comments individuals entered. The response values are also summed and averaged at the bottom of the report. R219 is only available as an Excel download. The image below shows an example of R209. In this example, the first question indicates 3 individuals' responses, the response values, and any of their comments.
The image below is an example of R219 with comments added by the manual author. 
R220 Proctor Authorized Evaluation
R220 displays the test attempts that selected proctors have authorized (Prova tests only). In step 3, you can group all Prova test publishes into one result.
The image below is an example of R220. 
R221 Group Taxonomy Performance
Run R221 to view the performance of taxonomy terms belonging to questions used within one or more Prova tests for selected groups of individuals. R221 identifies performance gaps and successes by presenting the percentage of questions answered correctly within the represented taxonomies. Taxonomy terms are automatically reported based on the selected tests. Individuals and their test attempts are listed separately on the report. Note that the questions themselves are not identified and test questions that are not associated with a specific taxonomy are not on the report. In step 3, you can group all published versions of Prova tests into one result.
The image below is an example of R221. 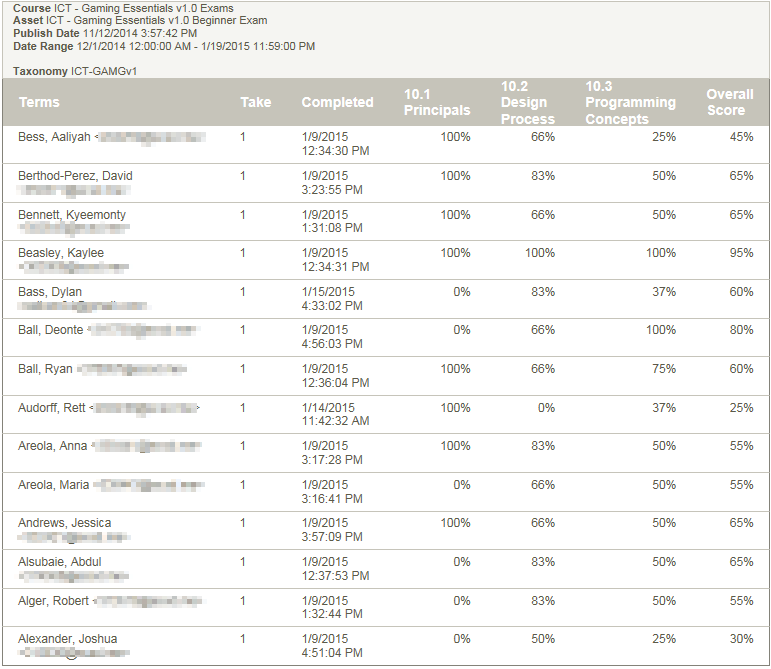
R223 Training Path Progress (Formerly Certification Sets)
![]() You may also be interested in R111, a similar report for individuals or R226, that reports individual user completions on each associated certification in the certification set.
You may also be interested in R111, a similar report for individuals or R226, that reports individual user completions on each associated certification in the certification set.
Run R223 to view the progress toward a training path (formerly certification set) for individuals in selected user groups. You can filter the report to see specific completion statuses (e.g. Not Started). The HTML version of this report lets you drill down to individual details that can also be exported, essentially running R111 Individual Training Path Progress.
The image below is an example of R223 filtered to show one training path with ALL completion statuses selected.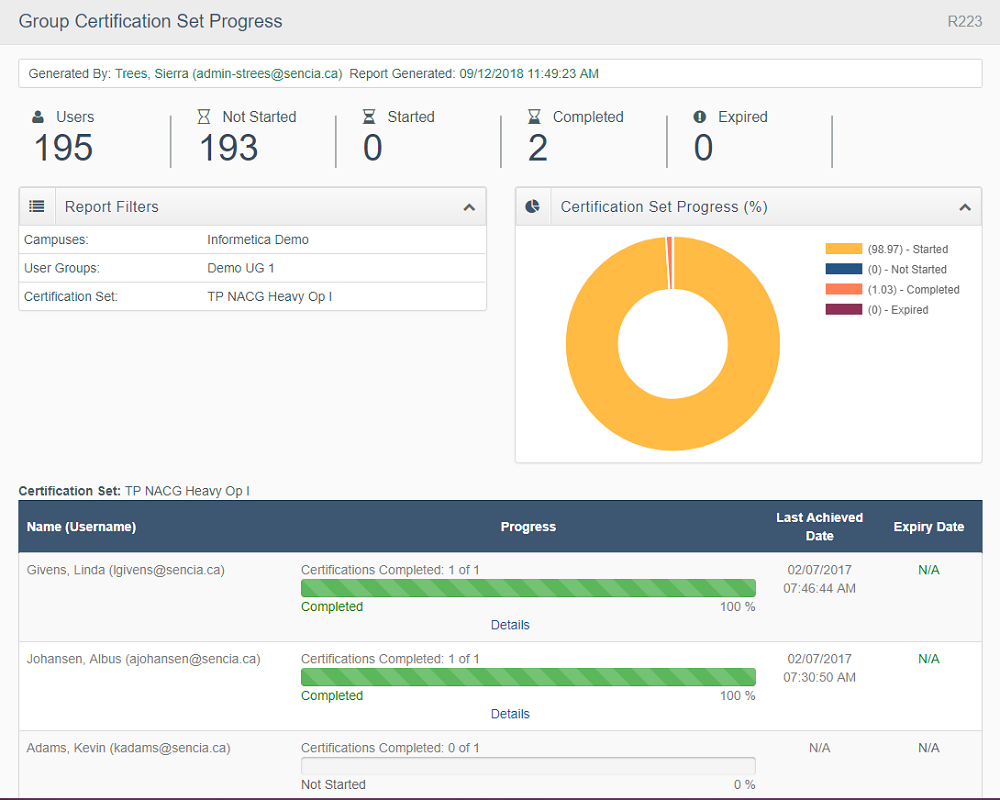
R224 Scheduled Course Enrollments
Run R224 to generate a list of individuals enroled to one or more scheduled courses, their dates of enrolment and completion, enrolment status, and the date that their enrolment status was last changed.
The image below is an example of R224 showing one specific scheduled course with no dates selected.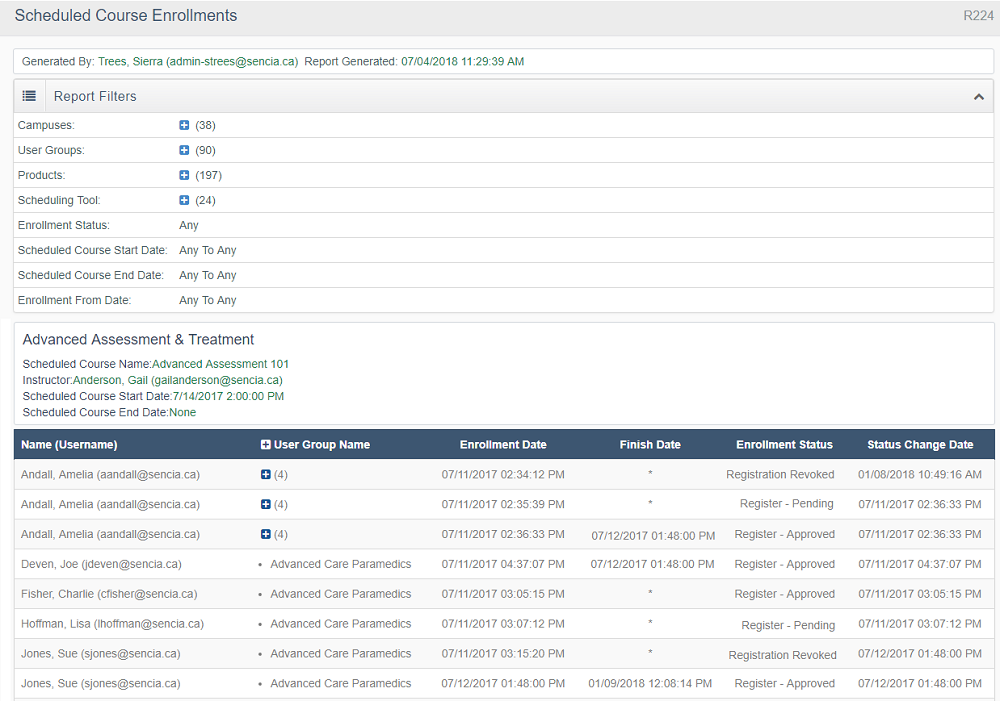
![]() This report is only useful if your system has the scheduling tool feature enabled. You may also be interested in R225 another scheduling tool report.
This report is only useful if your system has the scheduling tool feature enabled. You may also be interested in R225 another scheduling tool report.
R225 Scheduling Tool List
Run R225 to generate a list of all scheduled sessions for various date ranges and filters, such as instructor and course.
The image below is an example of R225 showing all schdelded items within a date range.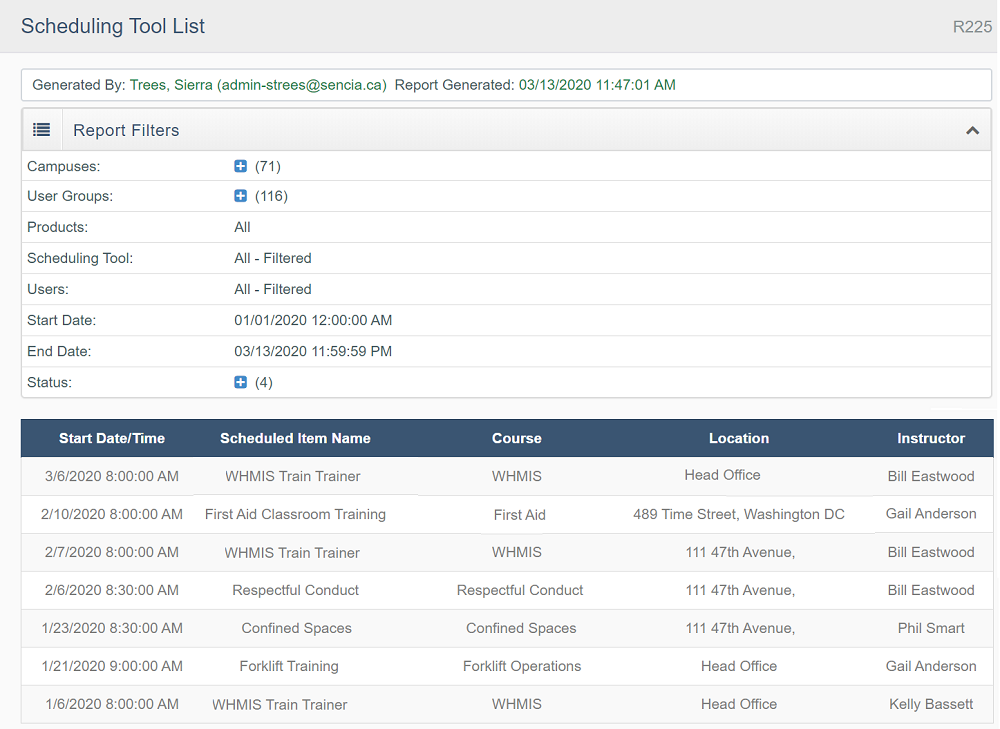
![]() Scheduling Tool
Scheduling Tool
This report is only useful if your system has the scheduling tool feature enabled.
You may also be interested in R224 another scheduling tool report.
R226 Training Path Group Details (Certification Set Group)
![]() You may also be interested in R111, a similar report for individuals or R223, that reports individual user progress towards a certification set.
You may also be interested in R111, a similar report for individuals or R223, that reports individual user progress towards a certification set.
Run R226 to view a group of users individual progress toward each certification within a selected training path (formerly called certification set.) You can filter the report to see specific completion statuses (e.g. Not Started).
The image below is an example of R226 with no completion status filters applied that shows one certification set.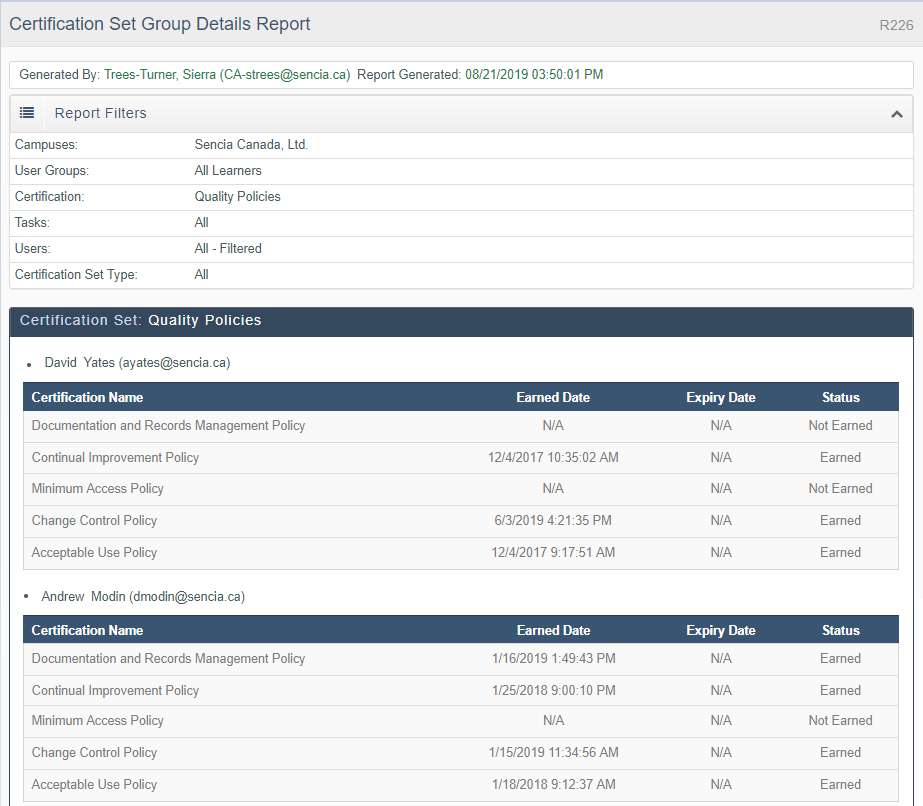
R227 Users Earned Certifications and Expiries
![]() This report shows only completed certifications. Site Managers can export this report directly from the certifications page by selecting Users from the Resources menu in the right (as R909). You may also be interested in R209, a similar report on certification progress.
This report shows only completed certifications. Site Managers can export this report directly from the certifications page by selecting Users from the Resources menu in the right (as R909). You may also be interested in R209, a similar report on certification progress.
Run R227 to view multiple completed certifications of selected users. The report shows the certification earn dates and any associated expiry information.
The image below is an example of R227 with two certifications: one with an expiry, the other without an expiry.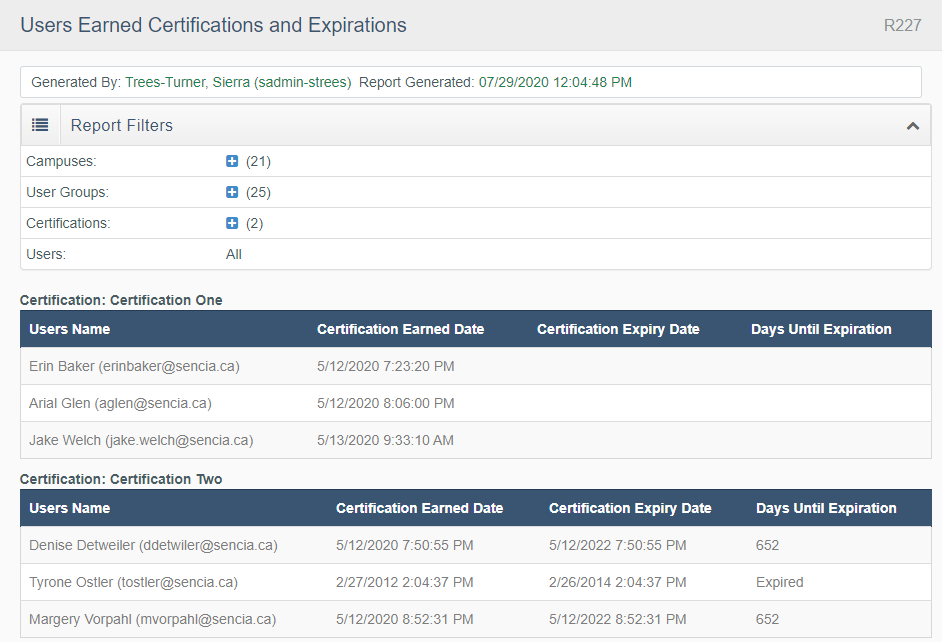
R301 Test Response Comparison
Run R301 to view and compare question level responses given within a defined test (Prova and classic Evaluations). R301 shows only question text and distractors for questions that have actually been answered.
The image below is an example of R301, showing question distractors. 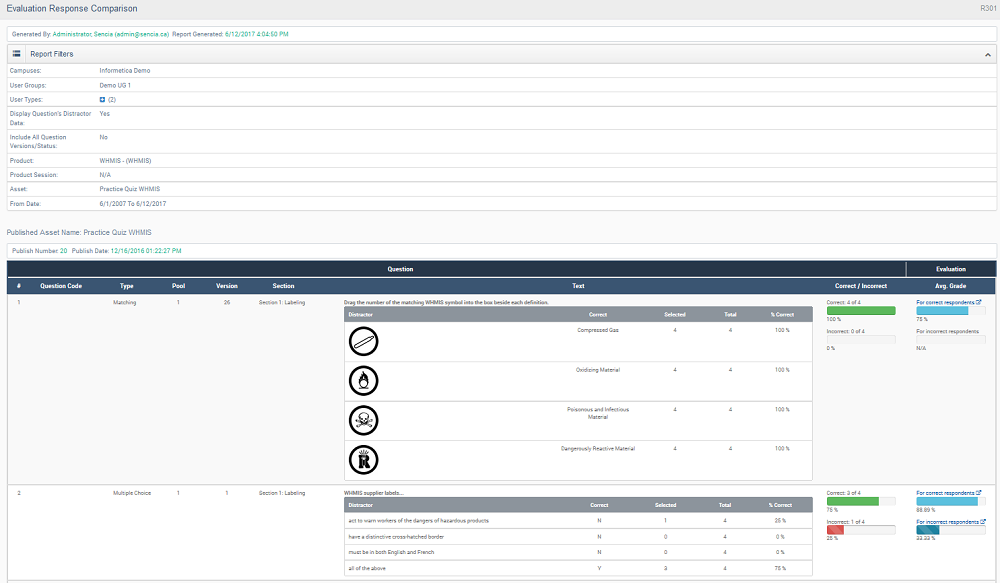
You can drill down on specific questions based on correct or incorrect responses to see a list of individuals and their test performance.
The image below is an example of an R301 Incorrect Response Report. 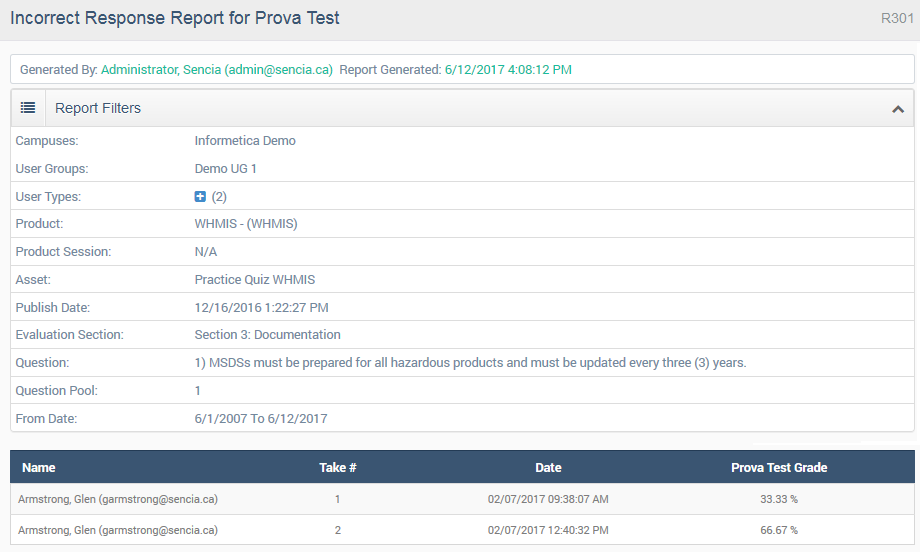
Classic Evaluation vs Prova Reporting
| Report Functionality | Prova | Classic Evaluations |
|---|---|---|
| Display Question Distractor Data Filter | Yes | No |
| Incorrect Question Analytics | Yes | Yes |
| Correct Question Analytics | Yes | No |
| Question Text Displayed | Yes, except for queries | Yes |
| Question Distractor Text Displayed | Yes | Yes |
Display Question Distractor Data Filter
When this filter is set to "No", the report will only display question text. When this filter is set to "Yes", you can report on distractor data for the following question types: Multiple Choice, True or False, Multiple Answer, Ranking, and Matching. Note that description answer questions (Fill in the Blank and Essay) are exceptions and therefore are not displayed.
Prova Publishes
Since information is only reported on questions that have been answered by indivuduals, this may affect the question data you see among multiple Prova publishes. This is due to the dynamic nature of question banks and multiple methods of dynamic test creation.
Question Bank Queries and Pooled Questions
Note that question bank queries and pooled questions may appear under the same question number. This is an expected result due to randomization and test configuration. You will only see the questions that have actually been presented and answered during a test attempt. In the example above, there are 2 questions that are both question 1.
The image below is an example of R301 showing Question Query.
The image below is an example of R301 showing Question Pools.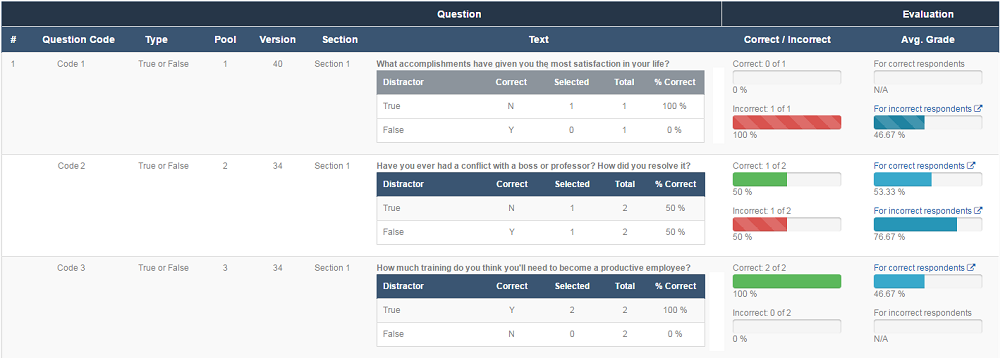
R401 Purchases
Run R401 to view eCommerce purchase details within a specified date range. This is a line item report that details purchases by purchaser name, date of purchase, items purchased and the amount charged. It also tallies the grand total charged within a specified date range.
The image below is an example of R401. 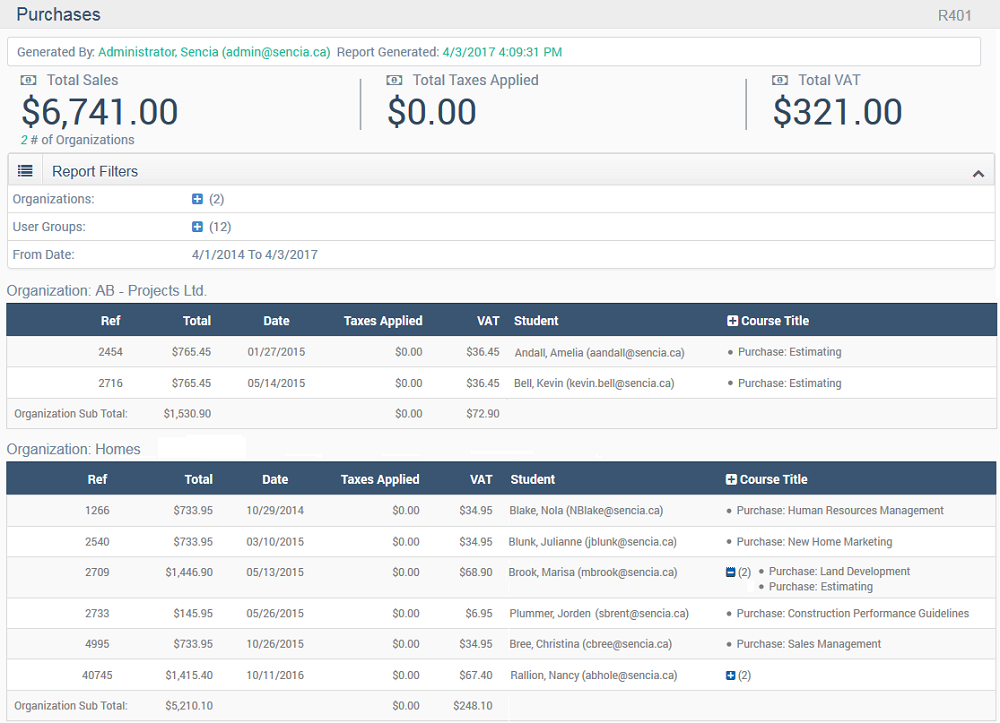
R402 Reconciliation Report
Run R402 to view detailed information for purchases (products, bundles, and extensions) and access codes used within a certain date range for selected campuses and user groups. This data-rich report is broken up into separate transactions for purchases and access codes. Each section is sub-totaled with a grand total provided at the bottom.
The image below is an example of R402. 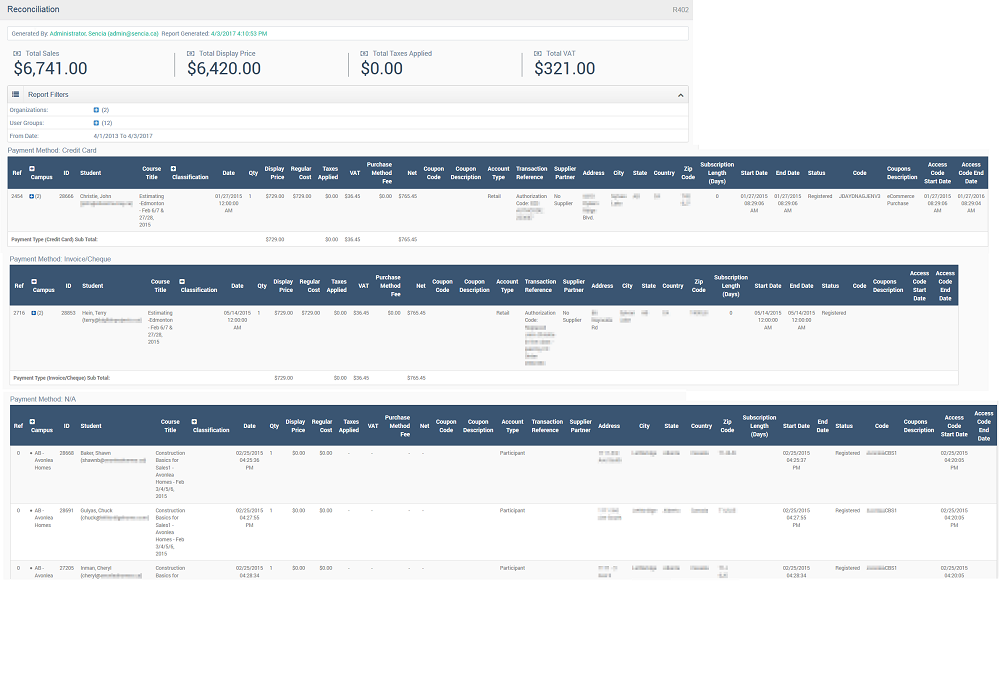
R403 External Supplemental Training
Run R403 to view groups of individuals within a date range that have external supplemental training attached to their profiles as well as details about the training that occurred. You can filter the results by selecting specific user groups and a date range that filters all training between the entered start dates. This report is only relevant to clients using the supplemental training feature.
The image below is an example of R403. 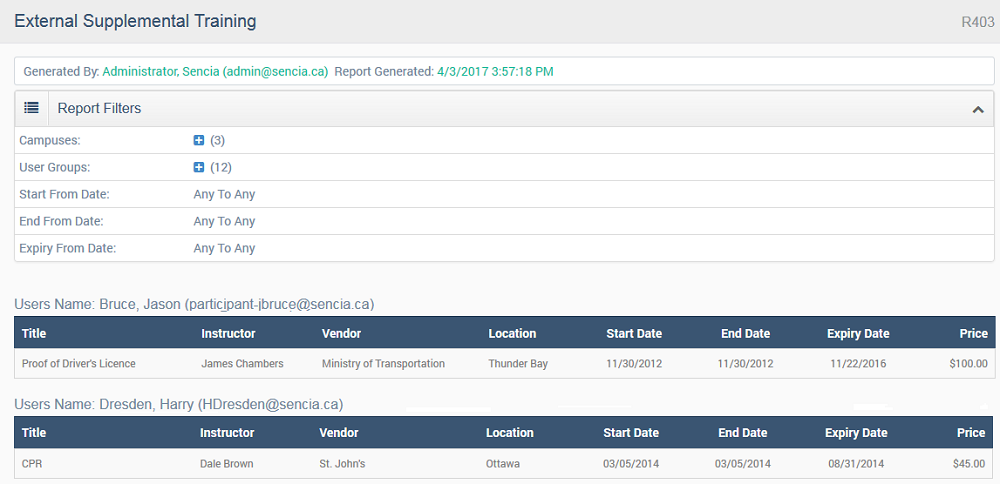
![]() End dates and expiry dates are optional and may even be disabled for this report. If you need either date range enabled for this report, a Site Manager can request it via the SRS tool.
End dates and expiry dates are optional and may even be disabled for this report. If you need either date range enabled for this report, a Site Manager can request it via the SRS tool.
R404 Internal Supplemental Training
Run R404 to view groups of individuals that have internal supplemental training attached to their profiles as well as details about the training that occurred. R404 can report the days until expiry for selected training based on today’s date, a filtered amount of days, and an expiry date range you supply. You can filter the results by selecting specific user groups, products, only products or assets with expiry dates and use several date ranges: start date, end date, and expiry date. Download in HTML, Excel, or CSV. The duration is the number of days remaining before the training expires, based on the report run date and expiry date. This report is only relevant to clients using the supplemental training feature.
The image below is an example of R404. 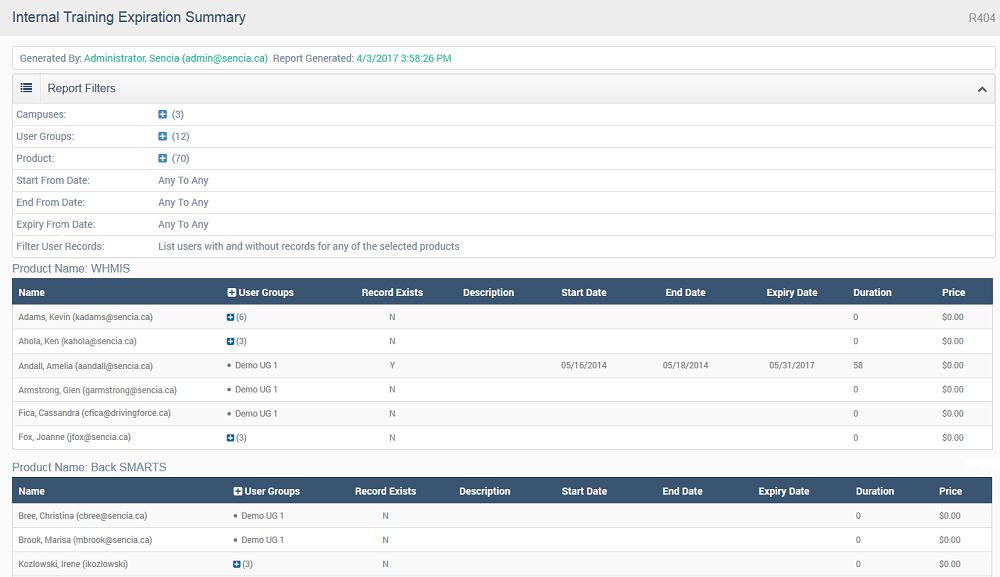
R405 User Enrollment Gaps
Run R405 to view a list of individuals within a user group who are not enroled in a specific product.
The image below is an example of R405. 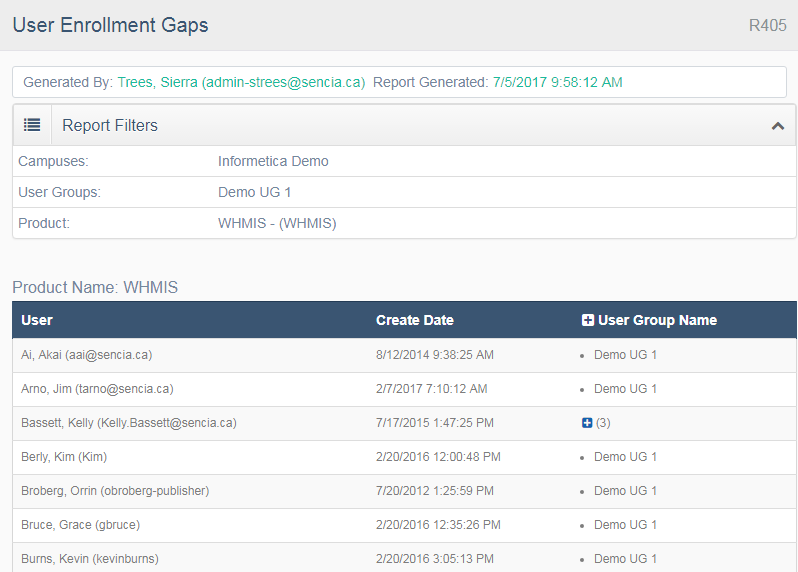
R501 Access Code List with Balance
Run R501 to view the number of times access codes have been used, the number of uses available (credits), and the number of remaining times the codes can be used (debits). You can run this report for selected campuses and user groups as well as for a specific access code or all access codes.
The image below is an example of R501. 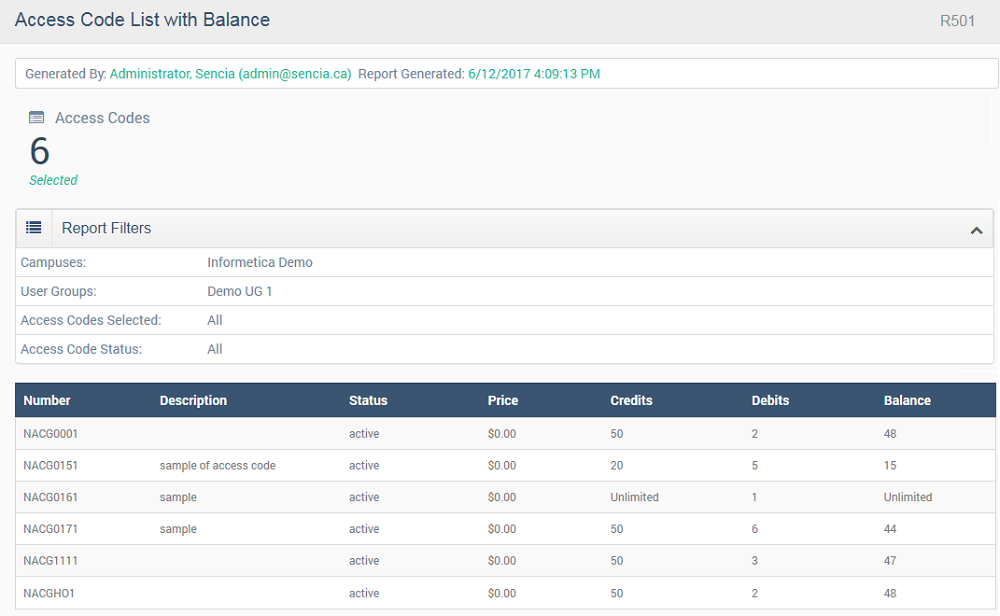
R502 Certification Rules and Details
Run R502 to view information related to a specific certification that is available to selected user groups.
The image below is an example of R502. 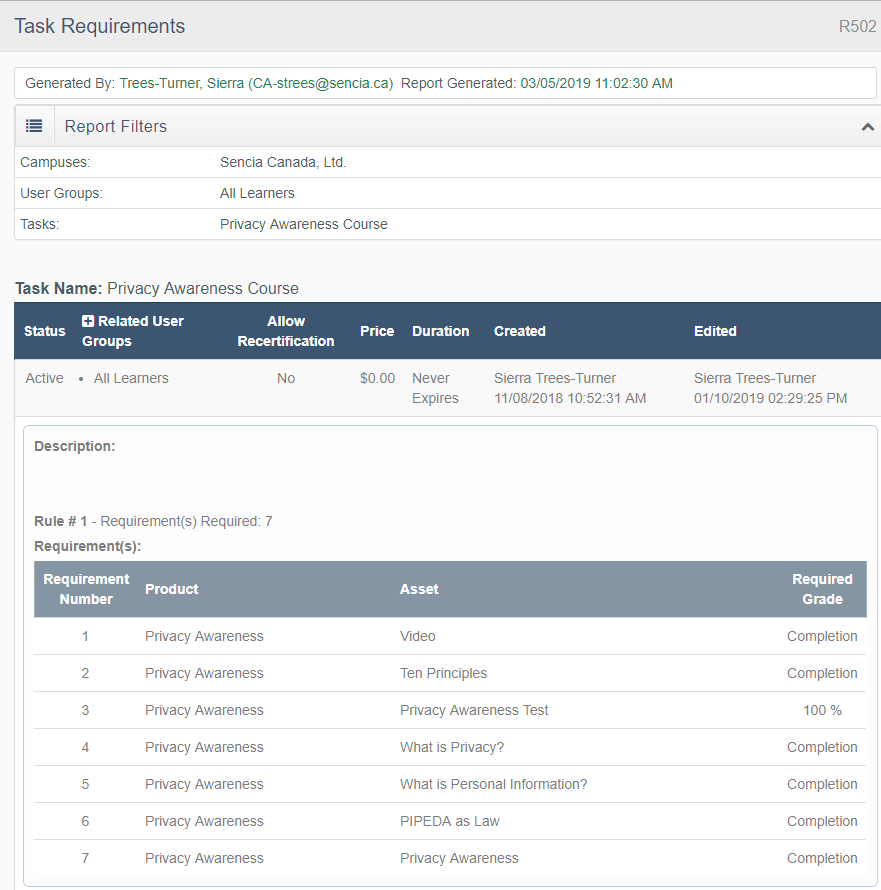
R503 Test Question Details
Run R503 to view an overview of a single evaluation or questionnaire, generating a list of questions and weights for each answer or a single section of questions, generating a list of correct answers. This report does not provide an answer key for question bank queries.
The image below is an example of R503 reporting an evaluation with feedback for both correct and incorrect answers.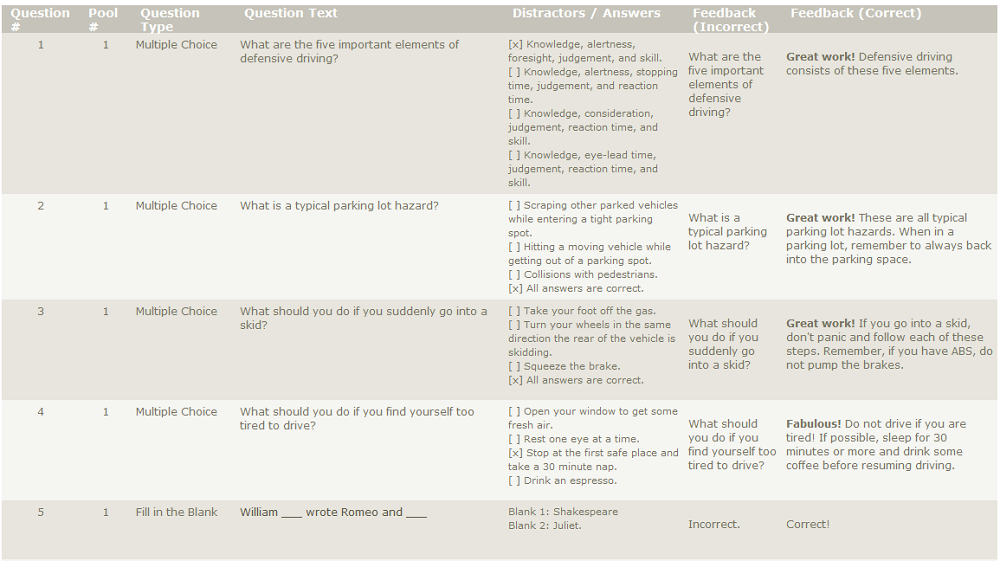
The image below is an example of R503 reporting on a questionnaire with 4 buckets with no feedback.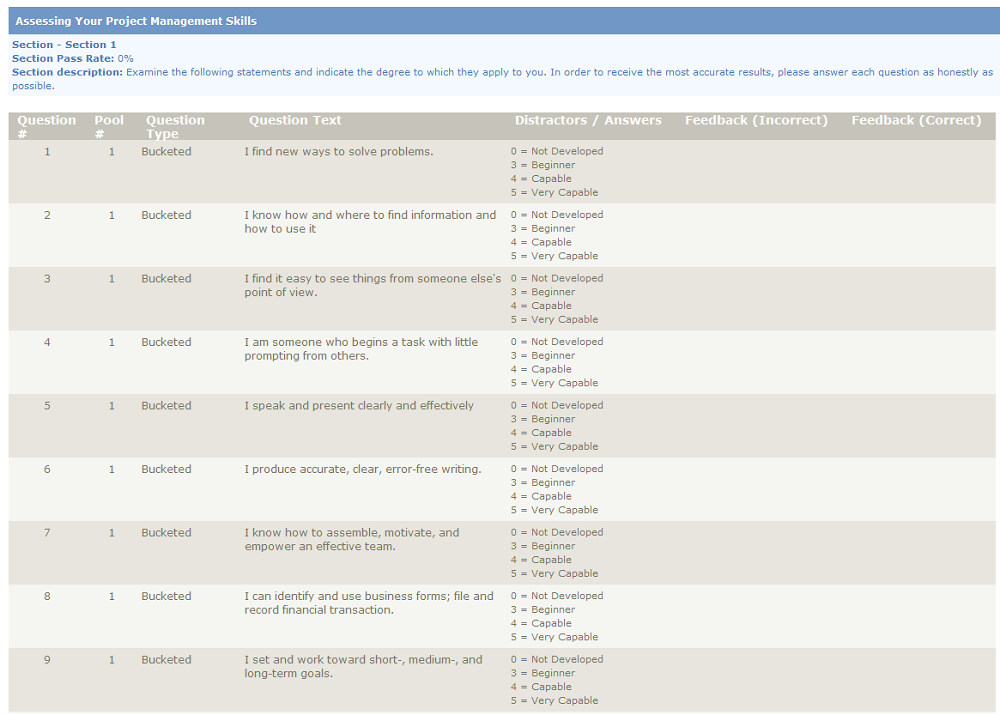
R504 Asset Exceptions
Run R504 to view information related to additional time and additional attempt exceptions granted to individuals for selected assets within a single product.
The image below is an example of R504.
R507 Product Exceptions
Run R507 to view information related to additional time and additional attempt exceptions granted to individuals for selected products.
The image below is an example of R507.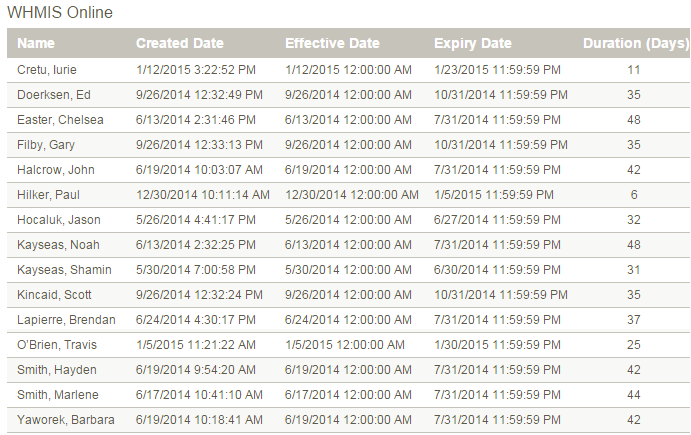
![]() Duration is the number of days that the exception is valid, calculated by subtracting the effective date of the expiry.
Duration is the number of days that the exception is valid, calculated by subtracting the effective date of the expiry.
R509 Certification by Approval Body
Run R509 to view individuals who have earned credits for the purpose of reporting to various certification approval bodies with a defined date range.
The image below is an example of R509.
R601 Product Login Duration by Participant
Run R601 to view the time individuals spent logged into selected products. Timestamps are every 15 seconds after a user opens a product. This is a product level report, so there are no details on specific assets. The report does not include users with no activity.
The image below is an example of R601.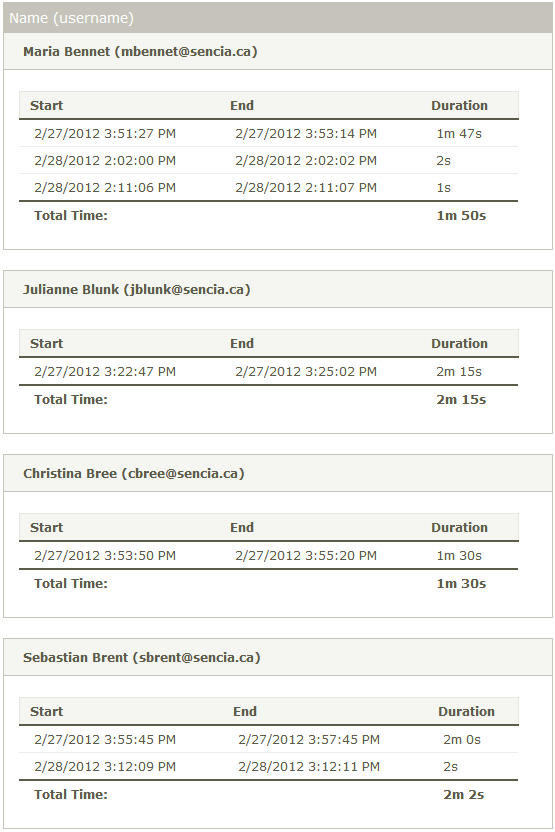
R602 Access Code User Details
Run R602 to view accounts created by using an access code as well as access codes used in SSO, granted by a manager, and those used in the quick register box. You can run this report for a specific access code or all access codes.
The image below is an example of R602.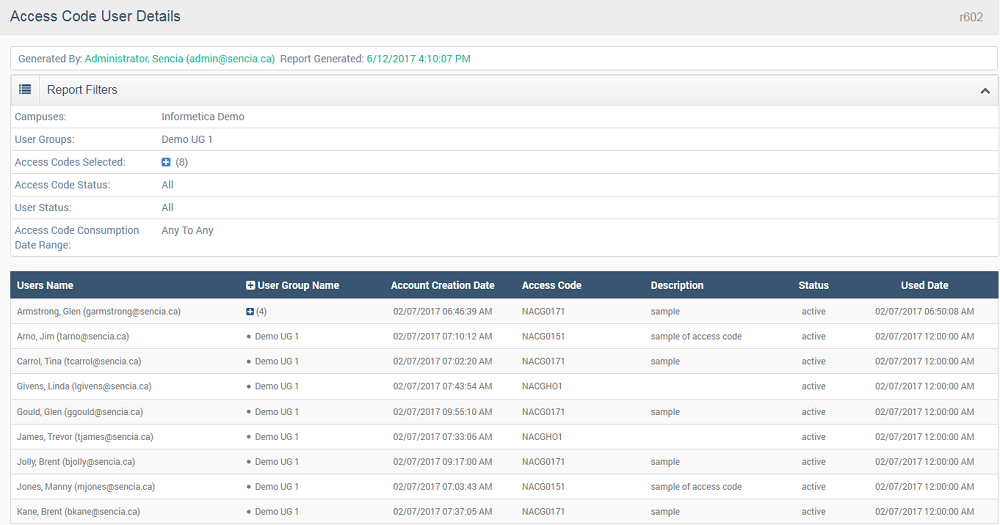
R603 System Registrations
Run R603 to view user accounts created within a defined date range based on account creation or last login. If no users or dates are selected, then the report will show individuals within the same user groups that the person running the report belongs to. This report’s default display is sorted by the user's last name. Export in HTML, Excel, or CSV format.
The image below is an example of R603.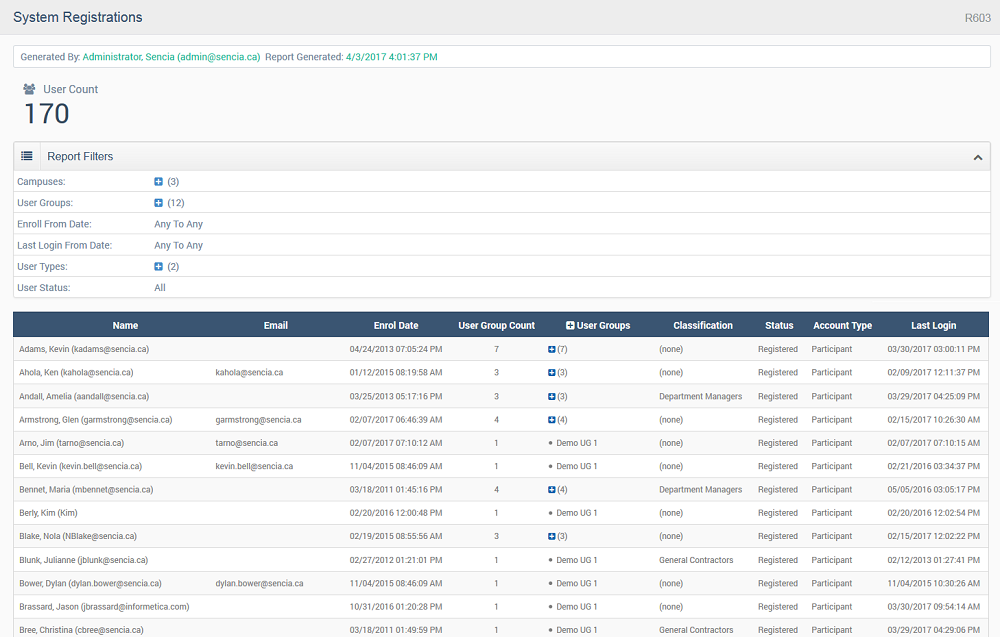
R604 Logins – Trend
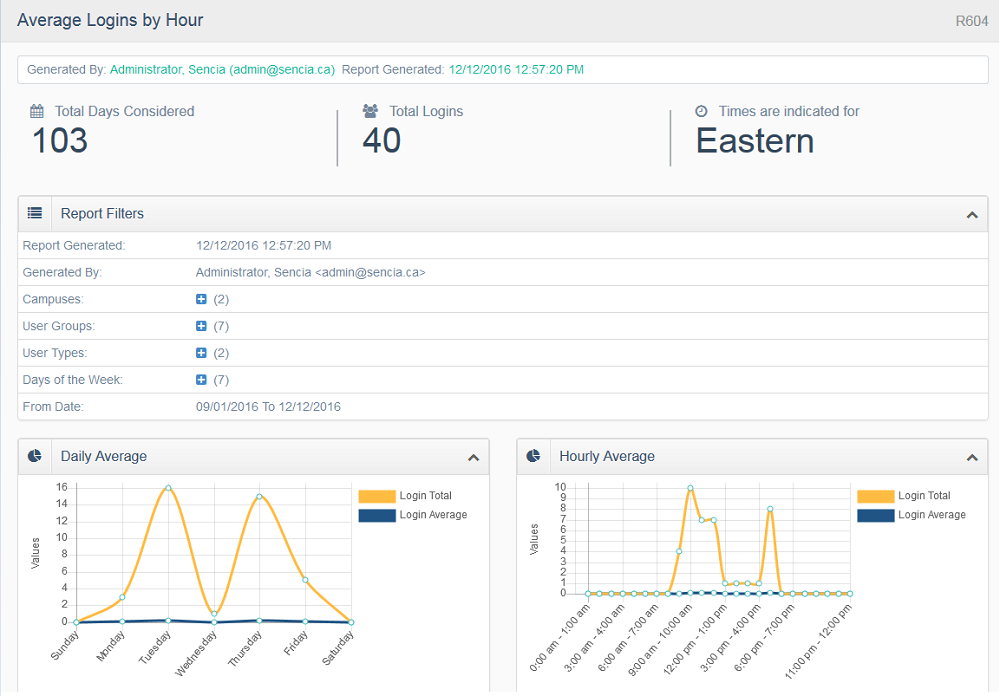
Run R604 to view the total and the average number of system logins within a defined date range. The report has graphs that visually represent the daily and hourly averages followed by supporting data that details login totals and averages.
The image below shows an example of R604.