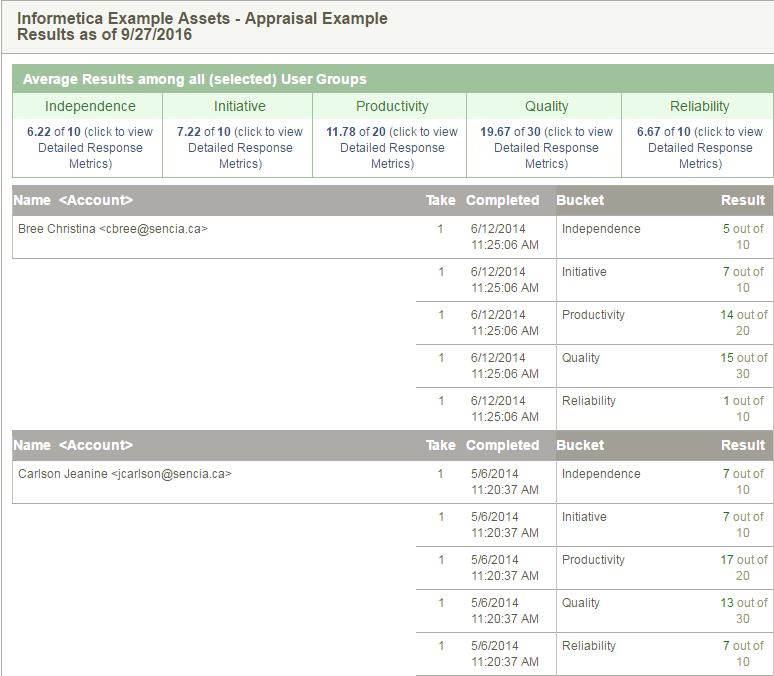
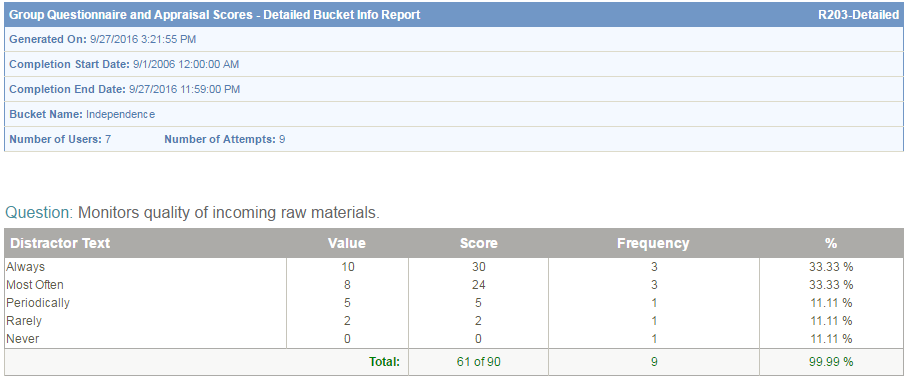
Run R203 to view the scores for each questionnaire or appraisal bucket including the section, the number of takes, and the average results of the selected user groups within each question bucket. Select detailed response metrics to see scores and frequency of specific distractors within each question.
The image below shows an example of R203.
The image below shows an example of detailed metrics for a selected bucket.

