For a given date range, run R106 to view the products a user has accessed and how much time the user has spent in them. The report also offers details on the duration of time the individual spent on the assets within a selected product. This image shows the Summary view. The graph shows the top products visited and the data below shows information for all products visited.
The image below shows an example of R106 run as a summary report with multiple products.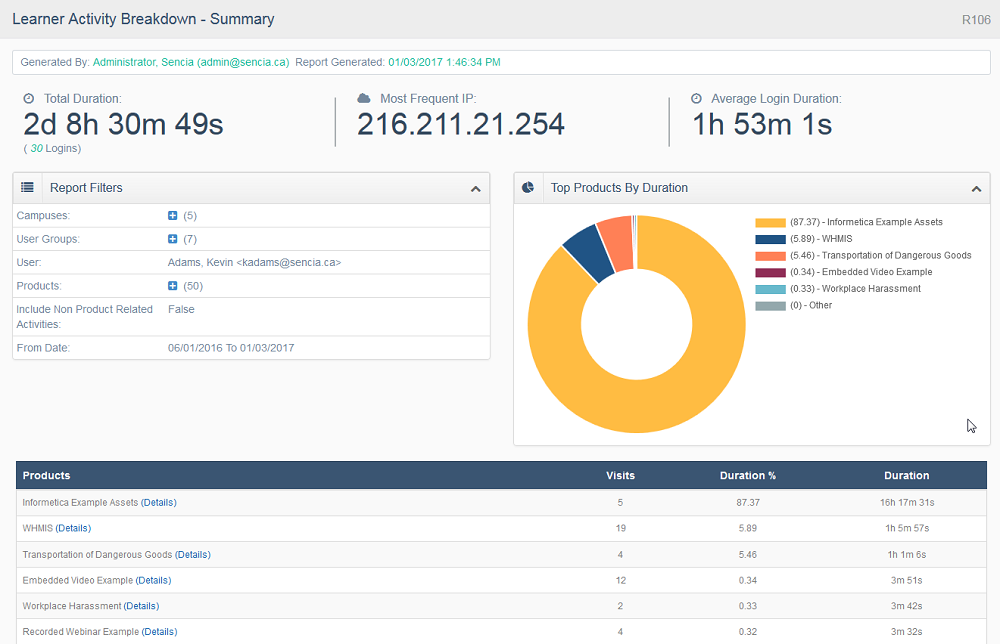
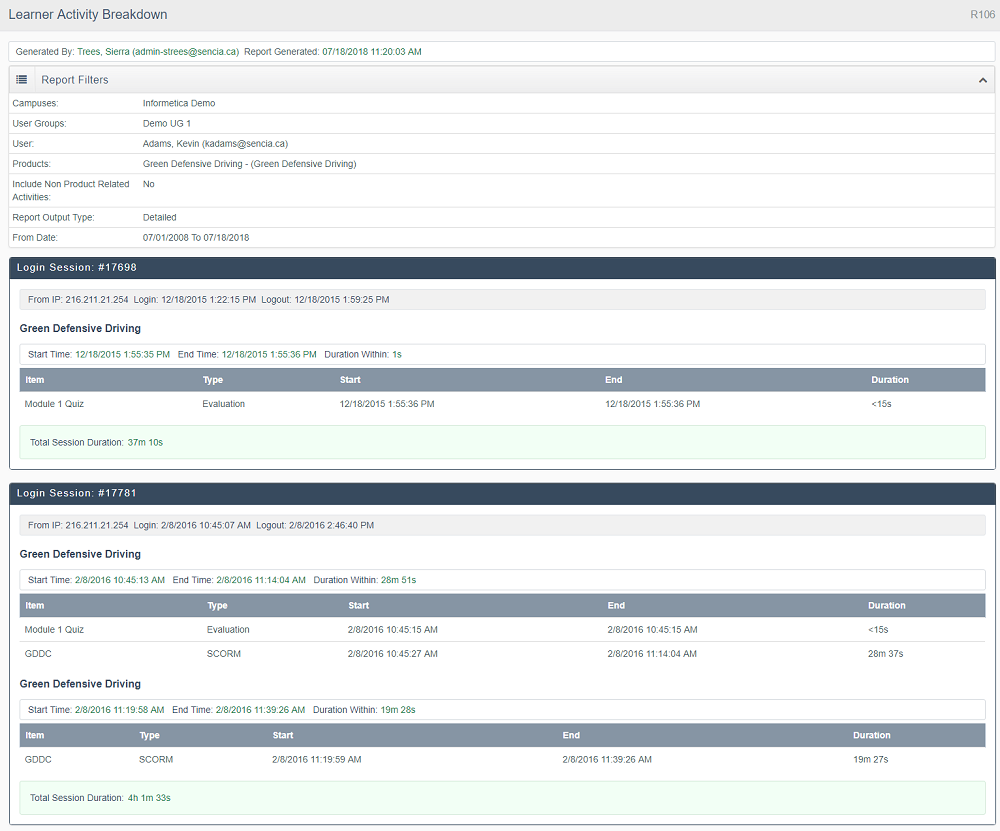
The image below shows an example of R106 showing the detailed view, accessed by selecting Details for a product from the Summary view.
For the selected product, the graph shows the top asset visited and the details below contain information for all assets visited.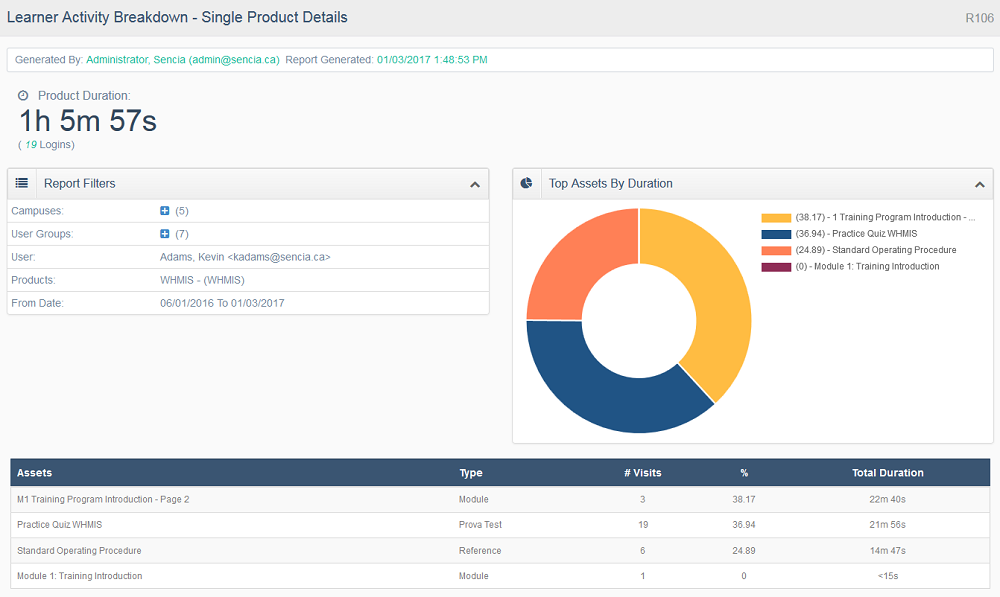
The image below shows an example of R106 run as a detailed report with one one product selected.